
Docs
PRISM Documentation
Trace, score, and guard your AI agents in production. Send your first trace in five minutes.
Platform: prism.blockconvey.com · Support: Tech@blockconvey.com
Contents
Introduction
What PRISM Does
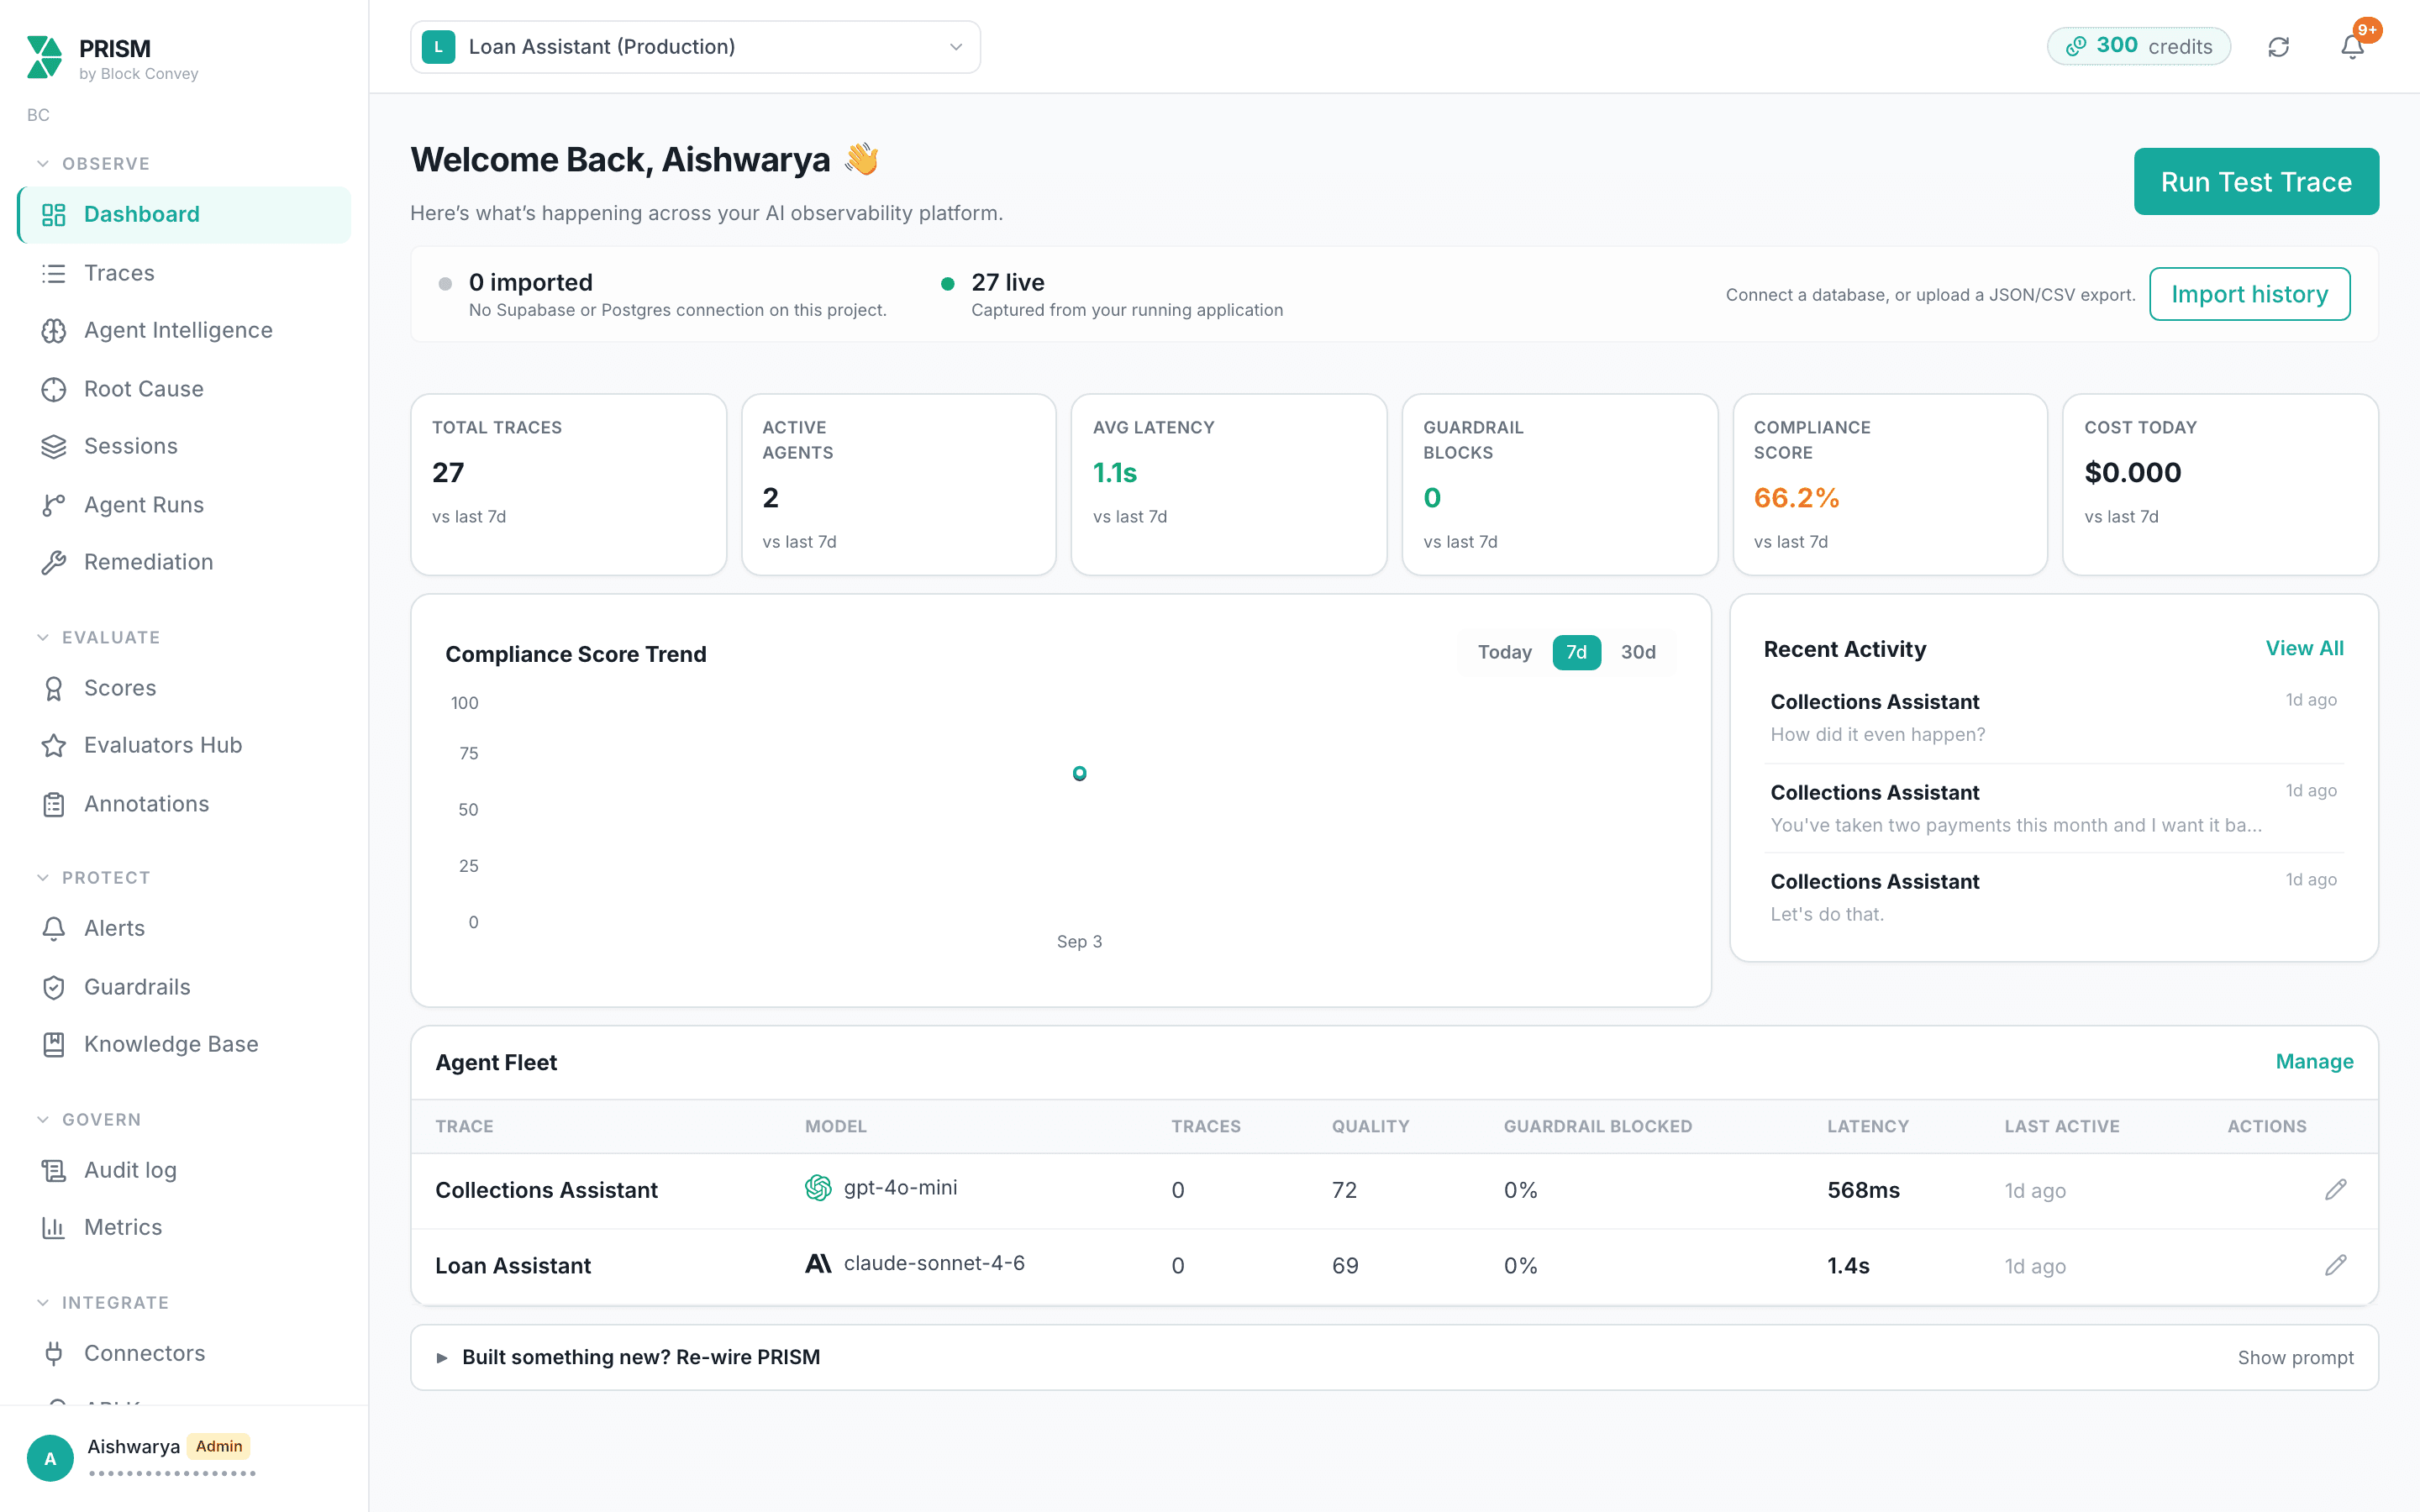
PRISM is an observability platform for AI agents. Your application sends PRISM a record of each exchange it has with a model. PRISM stores that record, scores it automatically, groups it into conversations and runs, watches it for the failures you care about, and tells you when something changes.
Everything starts from one HTTP call. Frameworks, the SDK, and the proxy are conveniences layered on top of it, so no integration path can do something the API cannot.
Core Concepts
| Term | What it is |
|---|---|
| Project | The isolation boundary. API keys, traces, guardrail rules, and alert rules all belong to exactly one project. Use one project per environment. |
| Trace | One exchange: the input messages, the agent's reply, and the model, latency, and token counts around it. The unit you send and the unit PRISM scores. |
| Session | Traces that share a session_id, assembled into one conversation. Send the same value for every turn of a conversation. |
| Agent run | The trajectory inside a single run: each model call, tool call, retrieval, and handoff. Produced automatically from spans when you use the SDK. |
| Span | One step inside a run. The framework handlers emit these; the HTTP endpoint does not. |
| Agent | Identified by the agent_id you send. Filters traces, scopes alert rules, and populates Model Inventory. |
Quickstart
Create an account at prism.blockconvey.com/signup. Signing up creates your organization and your first project. No invitation is needed.
1. Get Your Credentials
You need three values. Take the project ID from Settings → Project, and create a key on the API keys page.
# .env  --  never commit this file
PRISMTRACE_HOST=https://prism.blockconvey.com
PRISMTRACE_PROJECT_ID=00000000-0000-0000-0000-000000000000
PRISMTRACE_API_KEY=pt-sk-...echo '.env' >> .gitignore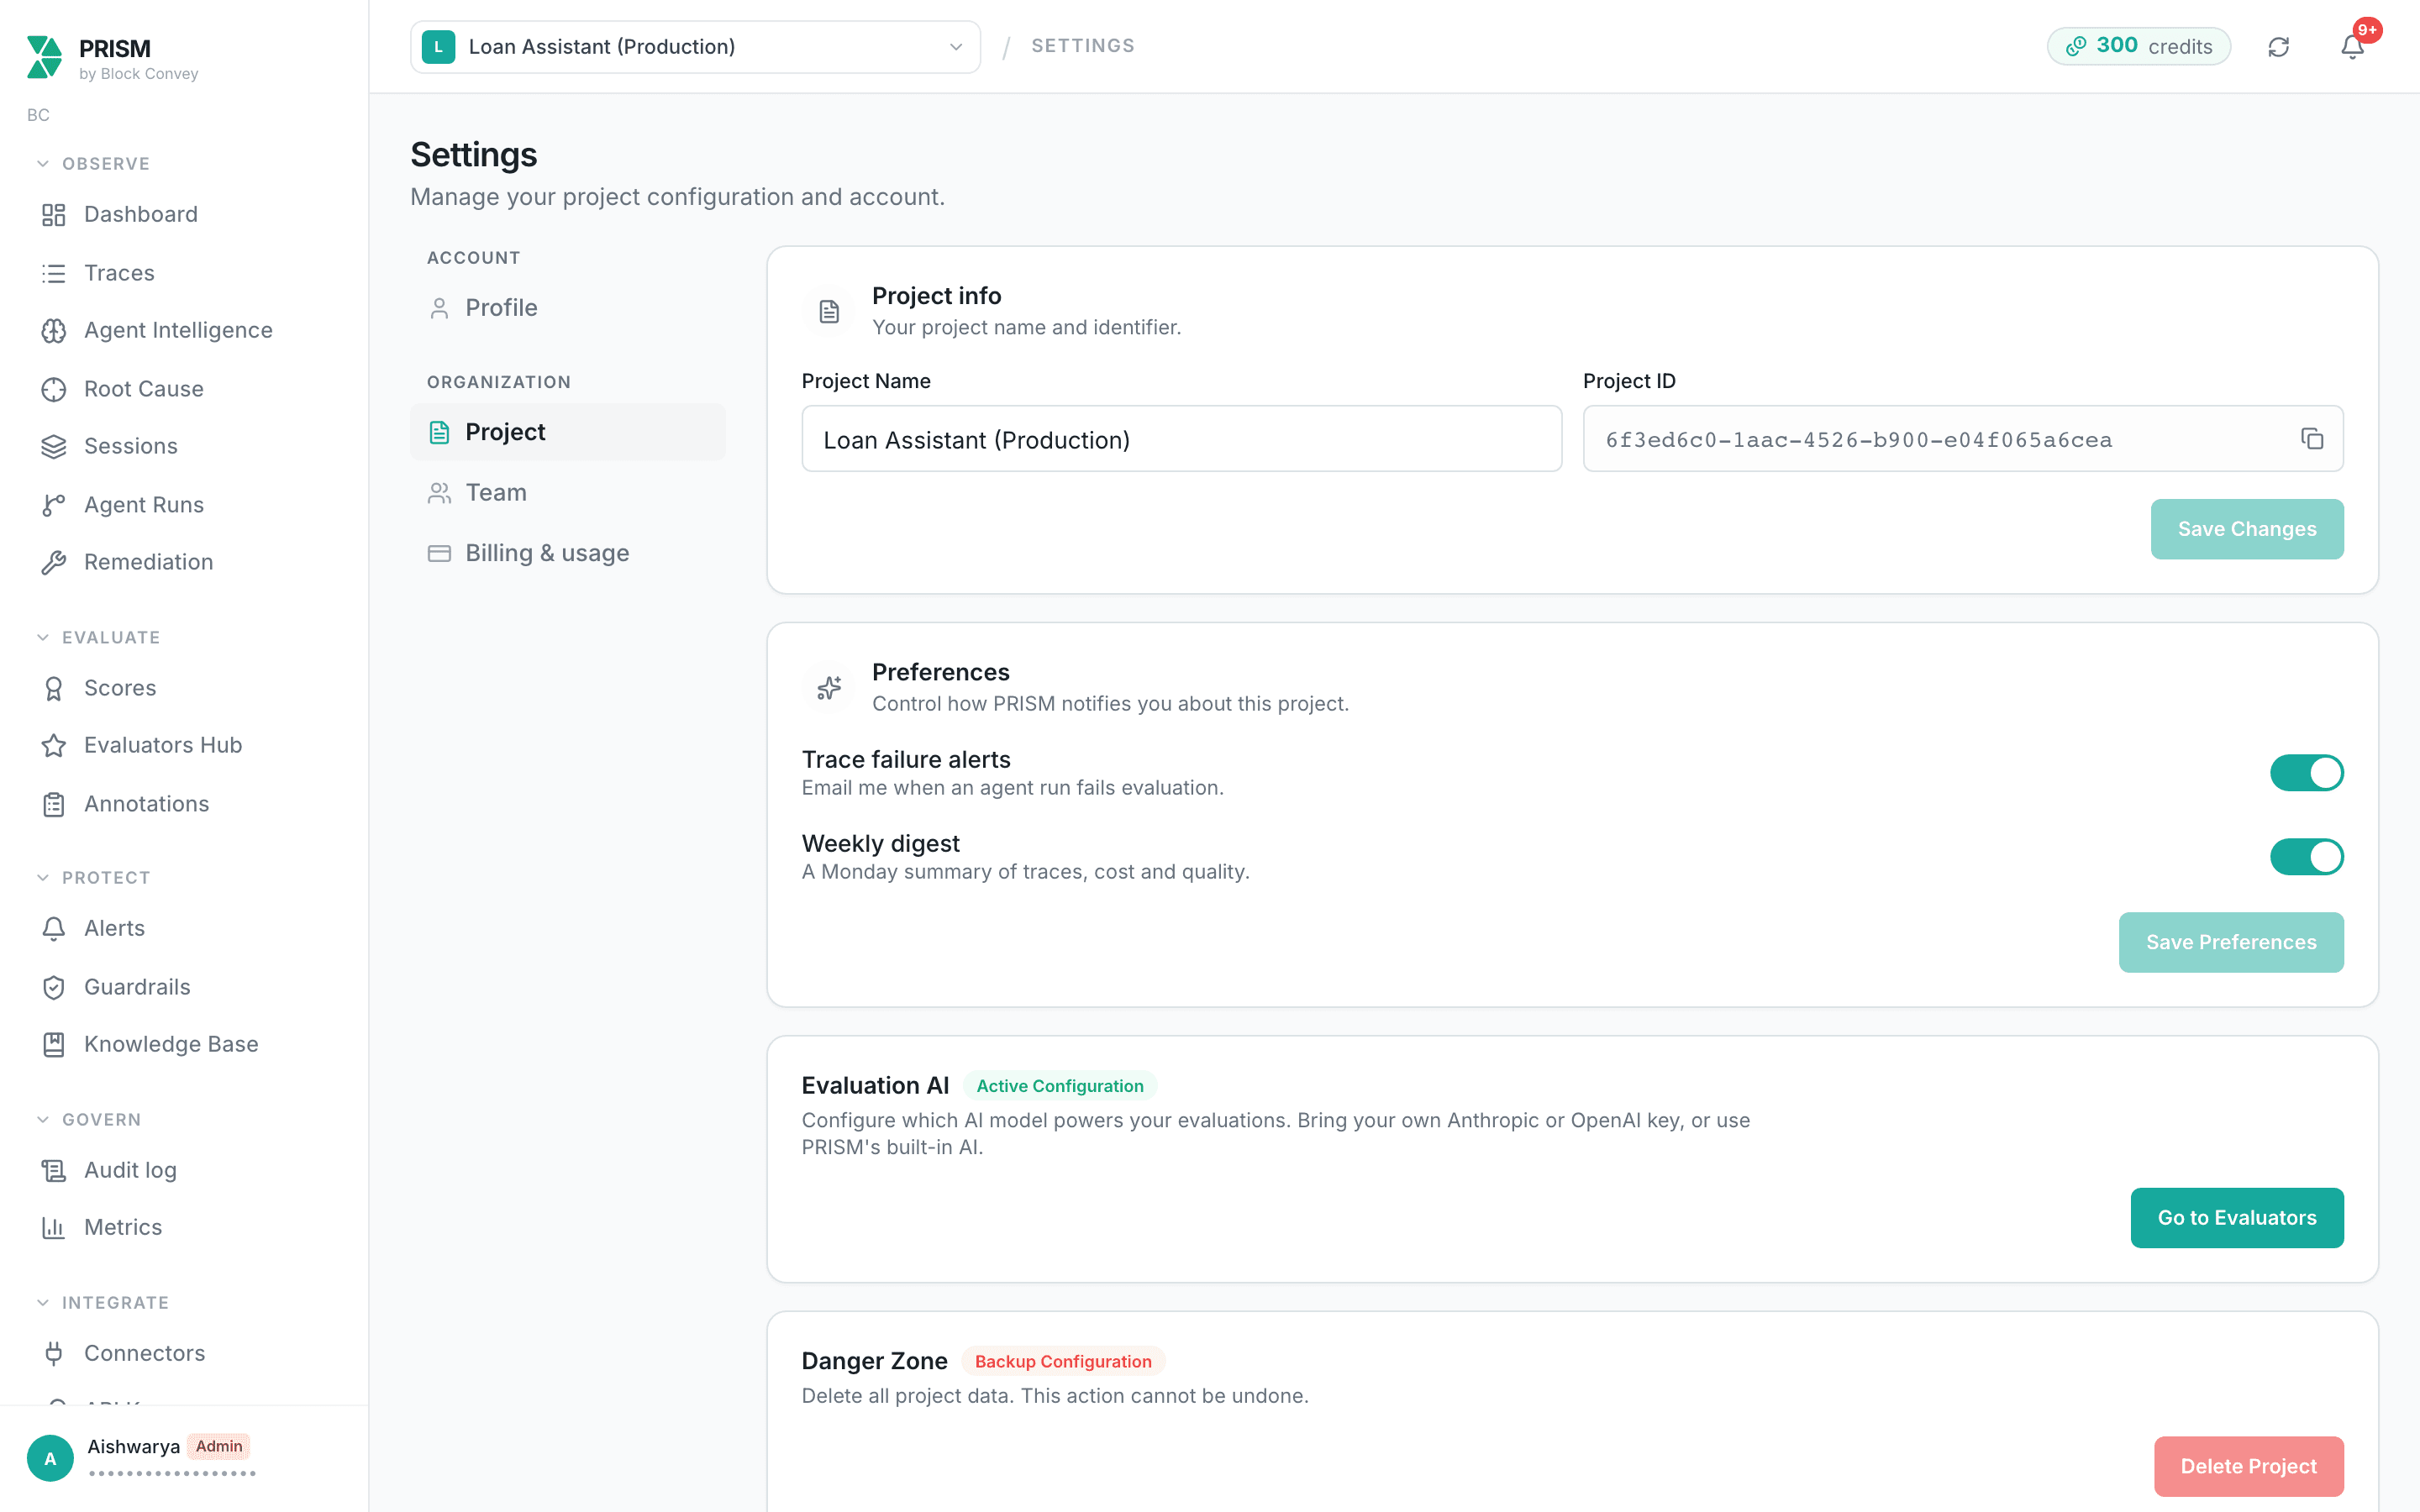
2. Send a Trace
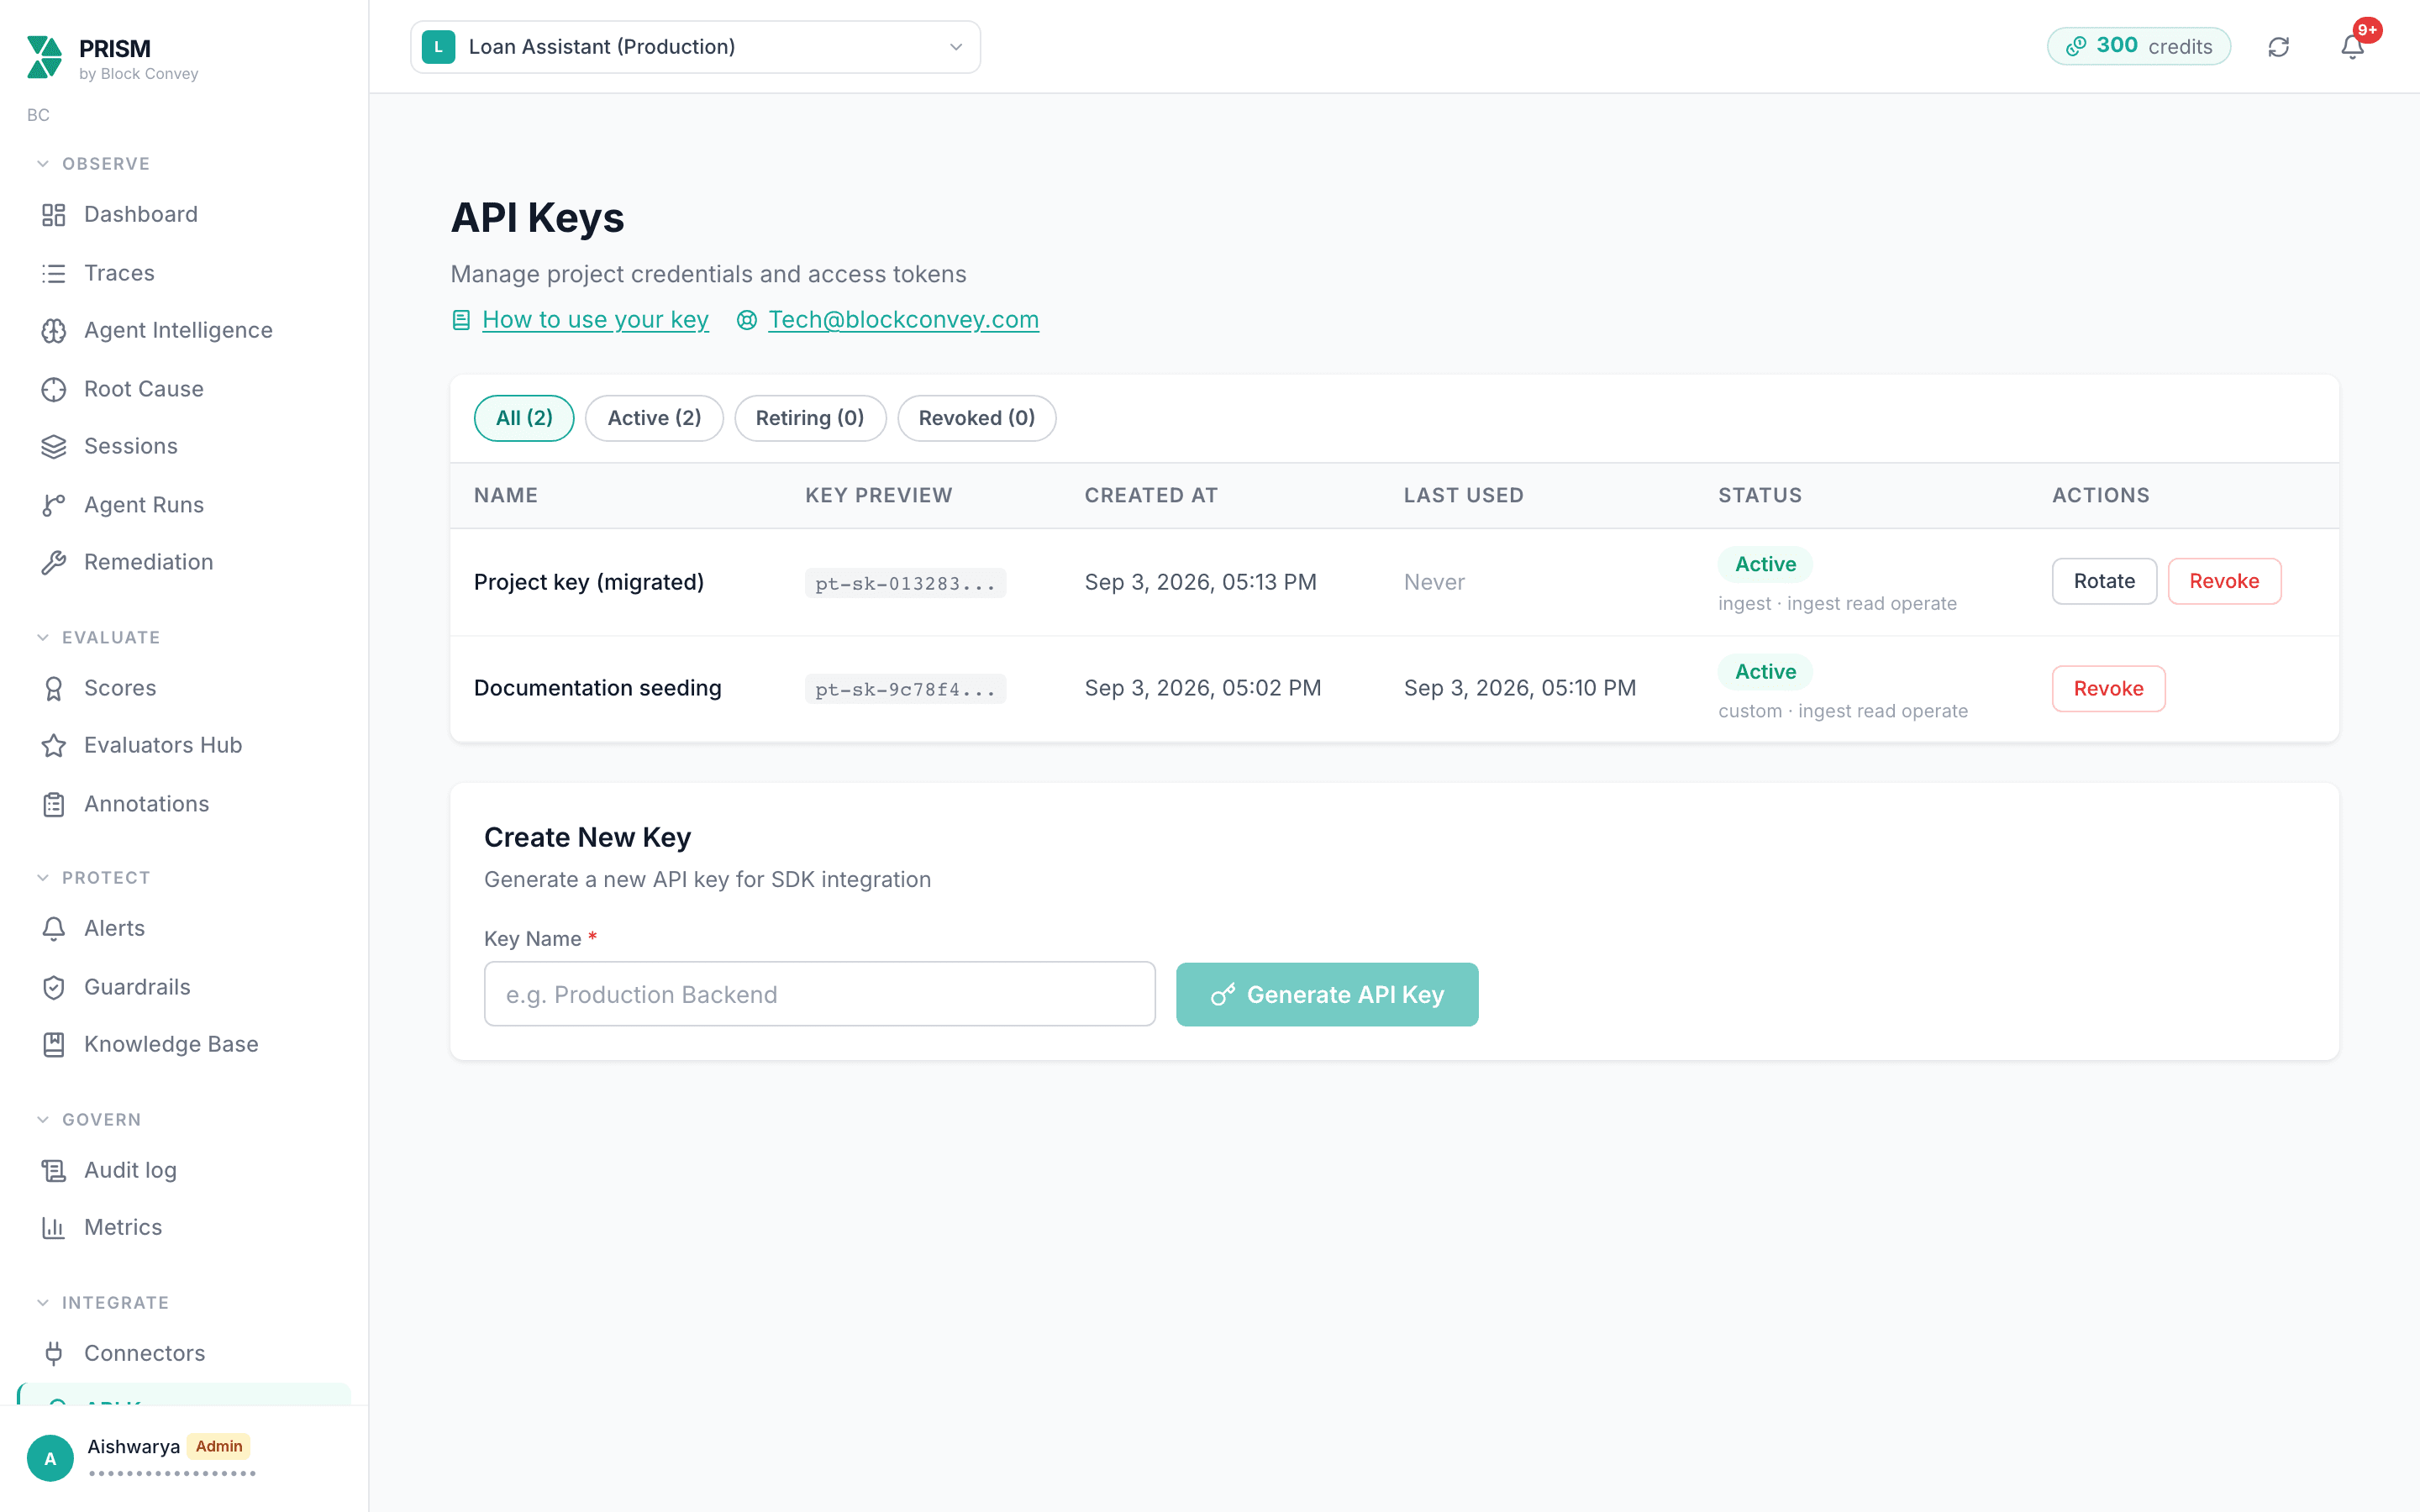
Every integration eventually does this. Run it once from your terminal to prove the credential works before wiring anything into your application.
curl -sS -X POST "$PRISMTRACE_HOST/api/traces" \
  -H "Content-Type: application/json" \
  -H "X-PRISMtrace-Key: $PRISMTRACE_API_KEY" \
  -d '{
    "project_id":     "'"$PRISMTRACE_PROJECT_ID"'",
    "model":          "claude-sonnet-4-6",
    "input_messages": [{"role": "user", "content": "What loan rates do you offer?"}],
    "output_message": "Our personal loan rates currently start at 7.9% APR.",
    "latency_ms":     420,
    "session_id":     "conversation-1",
    "agent_id":       "loan-assistant"
  }'
A 200 returns the stored trace, including its id and computed cost_usd. Open Traces and it is there.
3. Confirm It Landed
An empty dashboard has several possible causes that look identical from the outside. Connection health tells them apart, and the same information is available over the API.
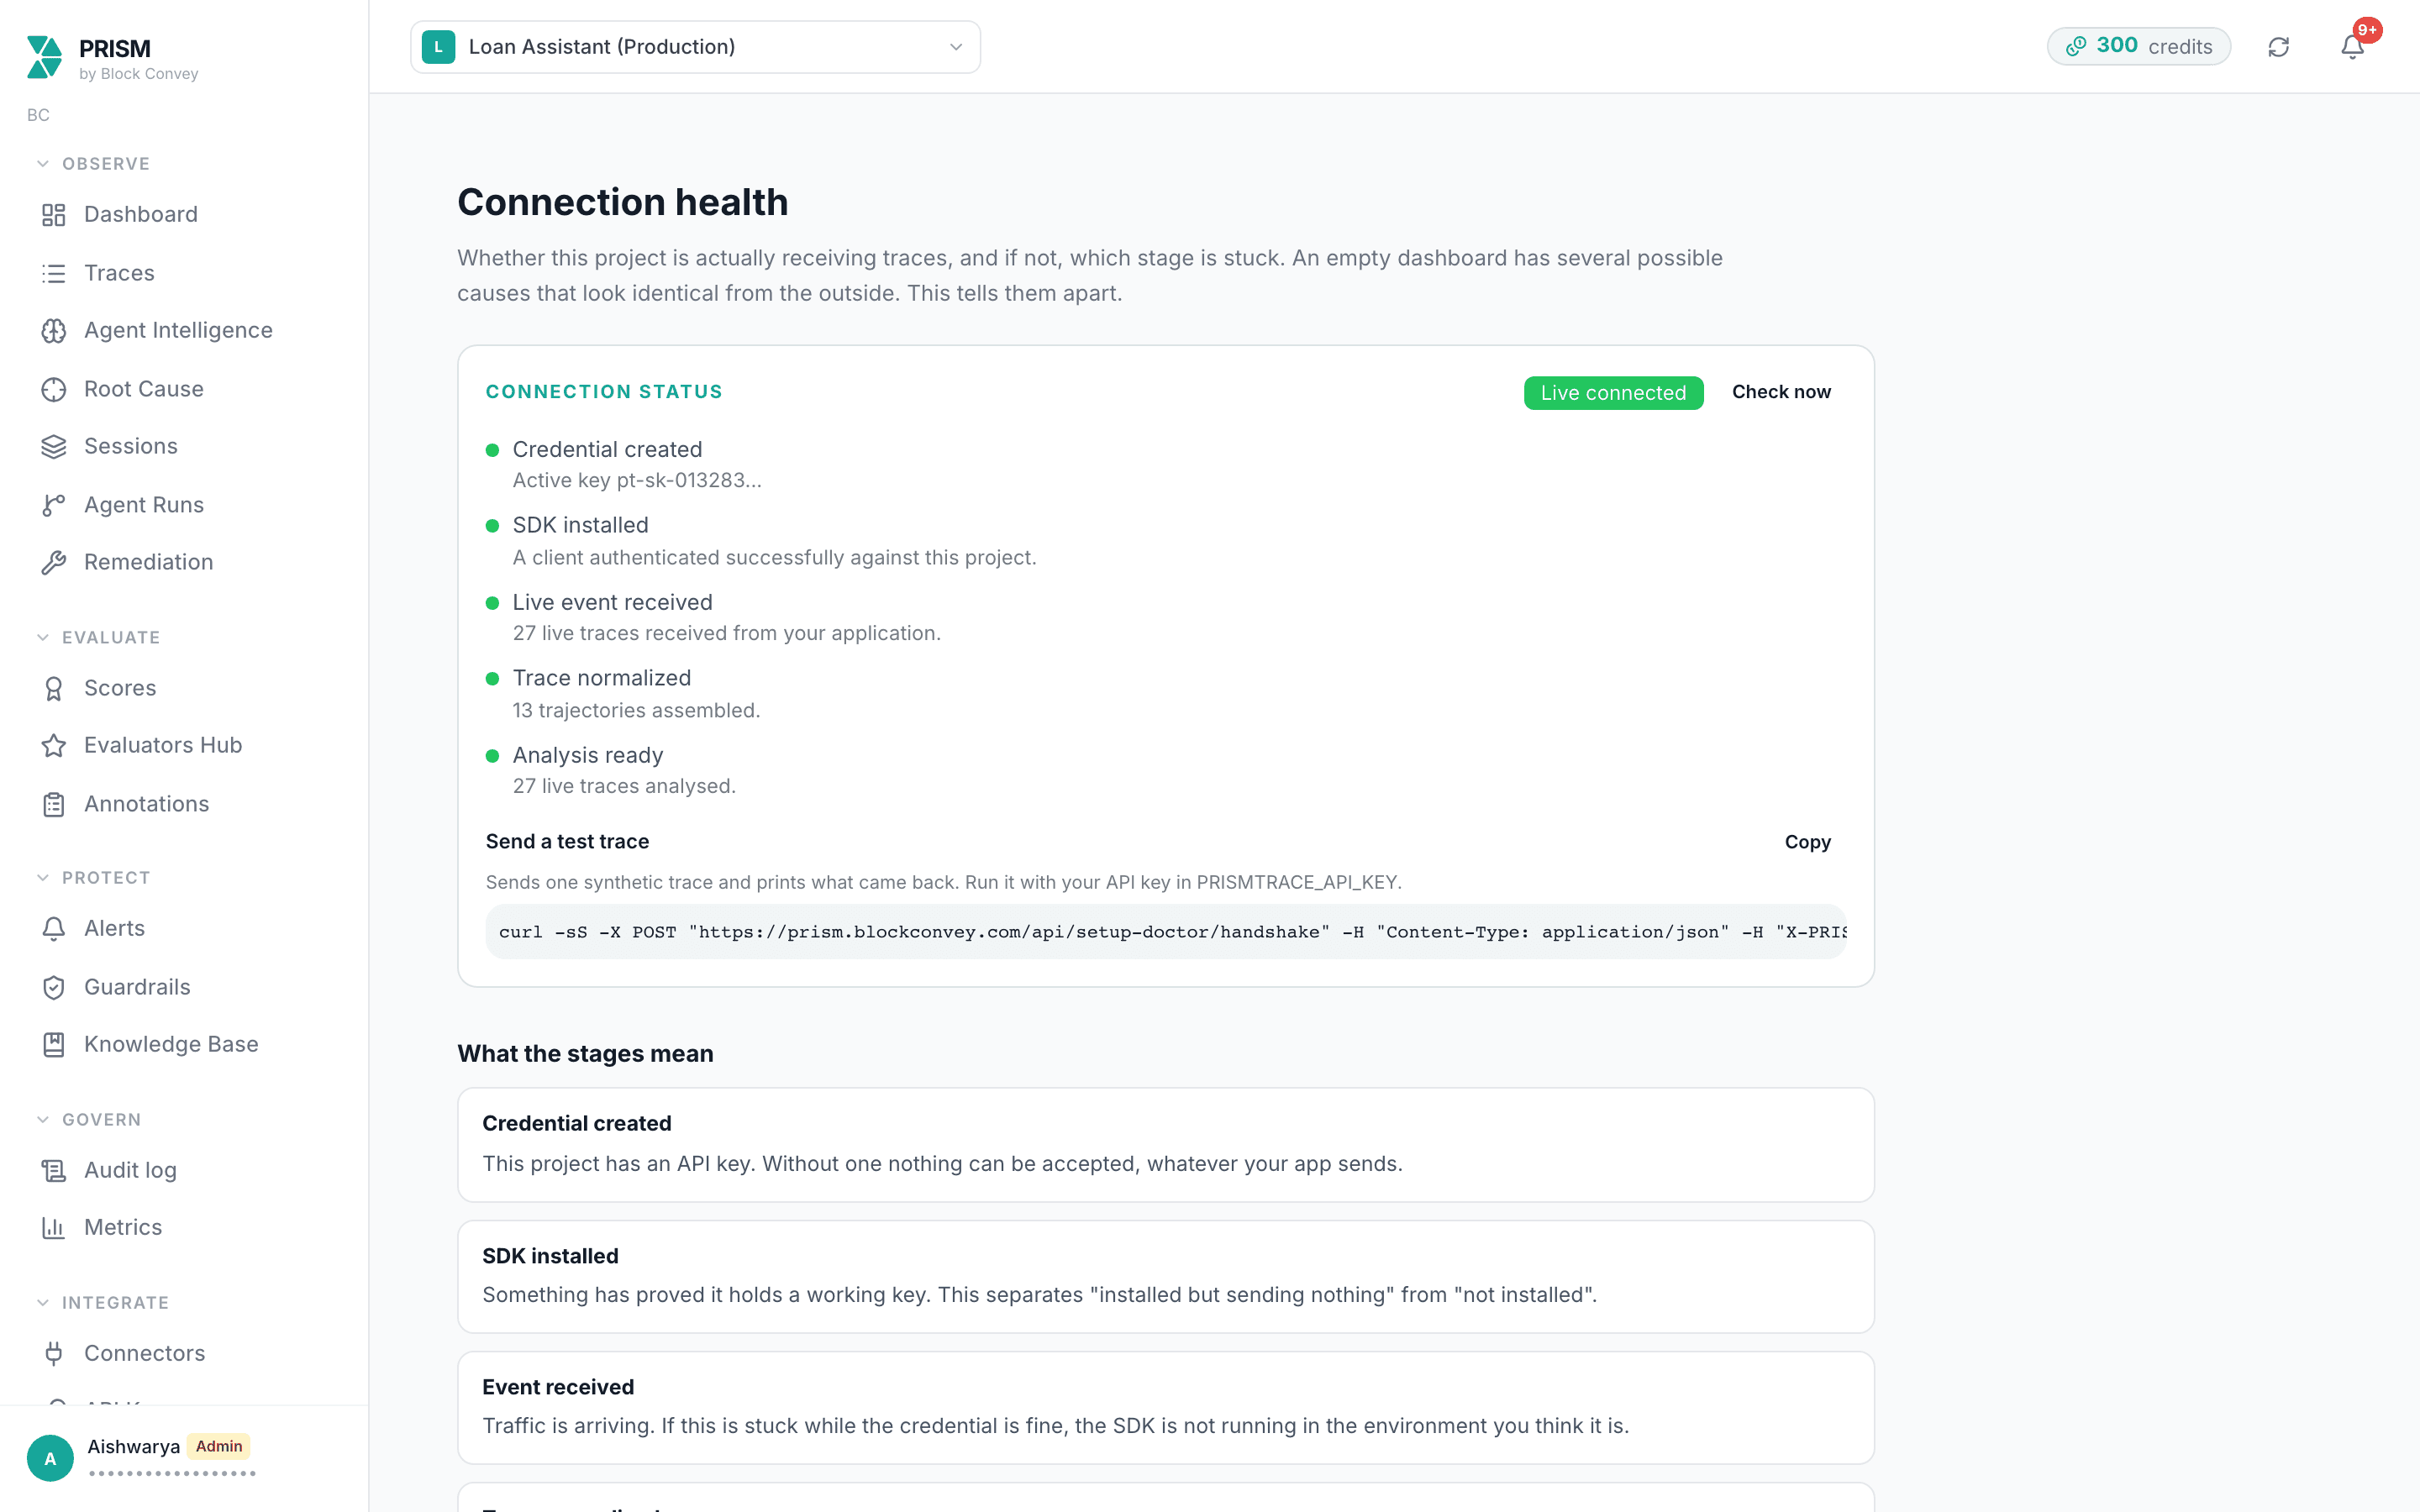
| Stage | Means |
|---|---|
| Credential created | The project has an API key. Without one, nothing is accepted whatever your app sends. |
| SDK installed | Something has proved it holds a working key. Separates "installed but sending nothing" from "not installed". |
| Live event received | Real traffic is arriving. If this is stuck while the credential is fine, your integration is not running where you think it is. |
| Trace normalized | Traces carry a shared session_id and have been assembled into runs. Stuck here means you are not sending one. |
| Analysis ready | Automatic scoring has caught up. Lagging here is normal and is not a setup failure. |
Programmatically:
curl -sS "$PRISMTRACE_HOST/api/setup-doctor?project_id=$PRISMTRACE_PROJECT_ID" \
  -H "X-PRISMtrace-Key: $PRISMTRACE_API_KEY"
Read live_connected and blocked_step. From a Python project, python -m prismtrace.verify does the same thing.
Integrations
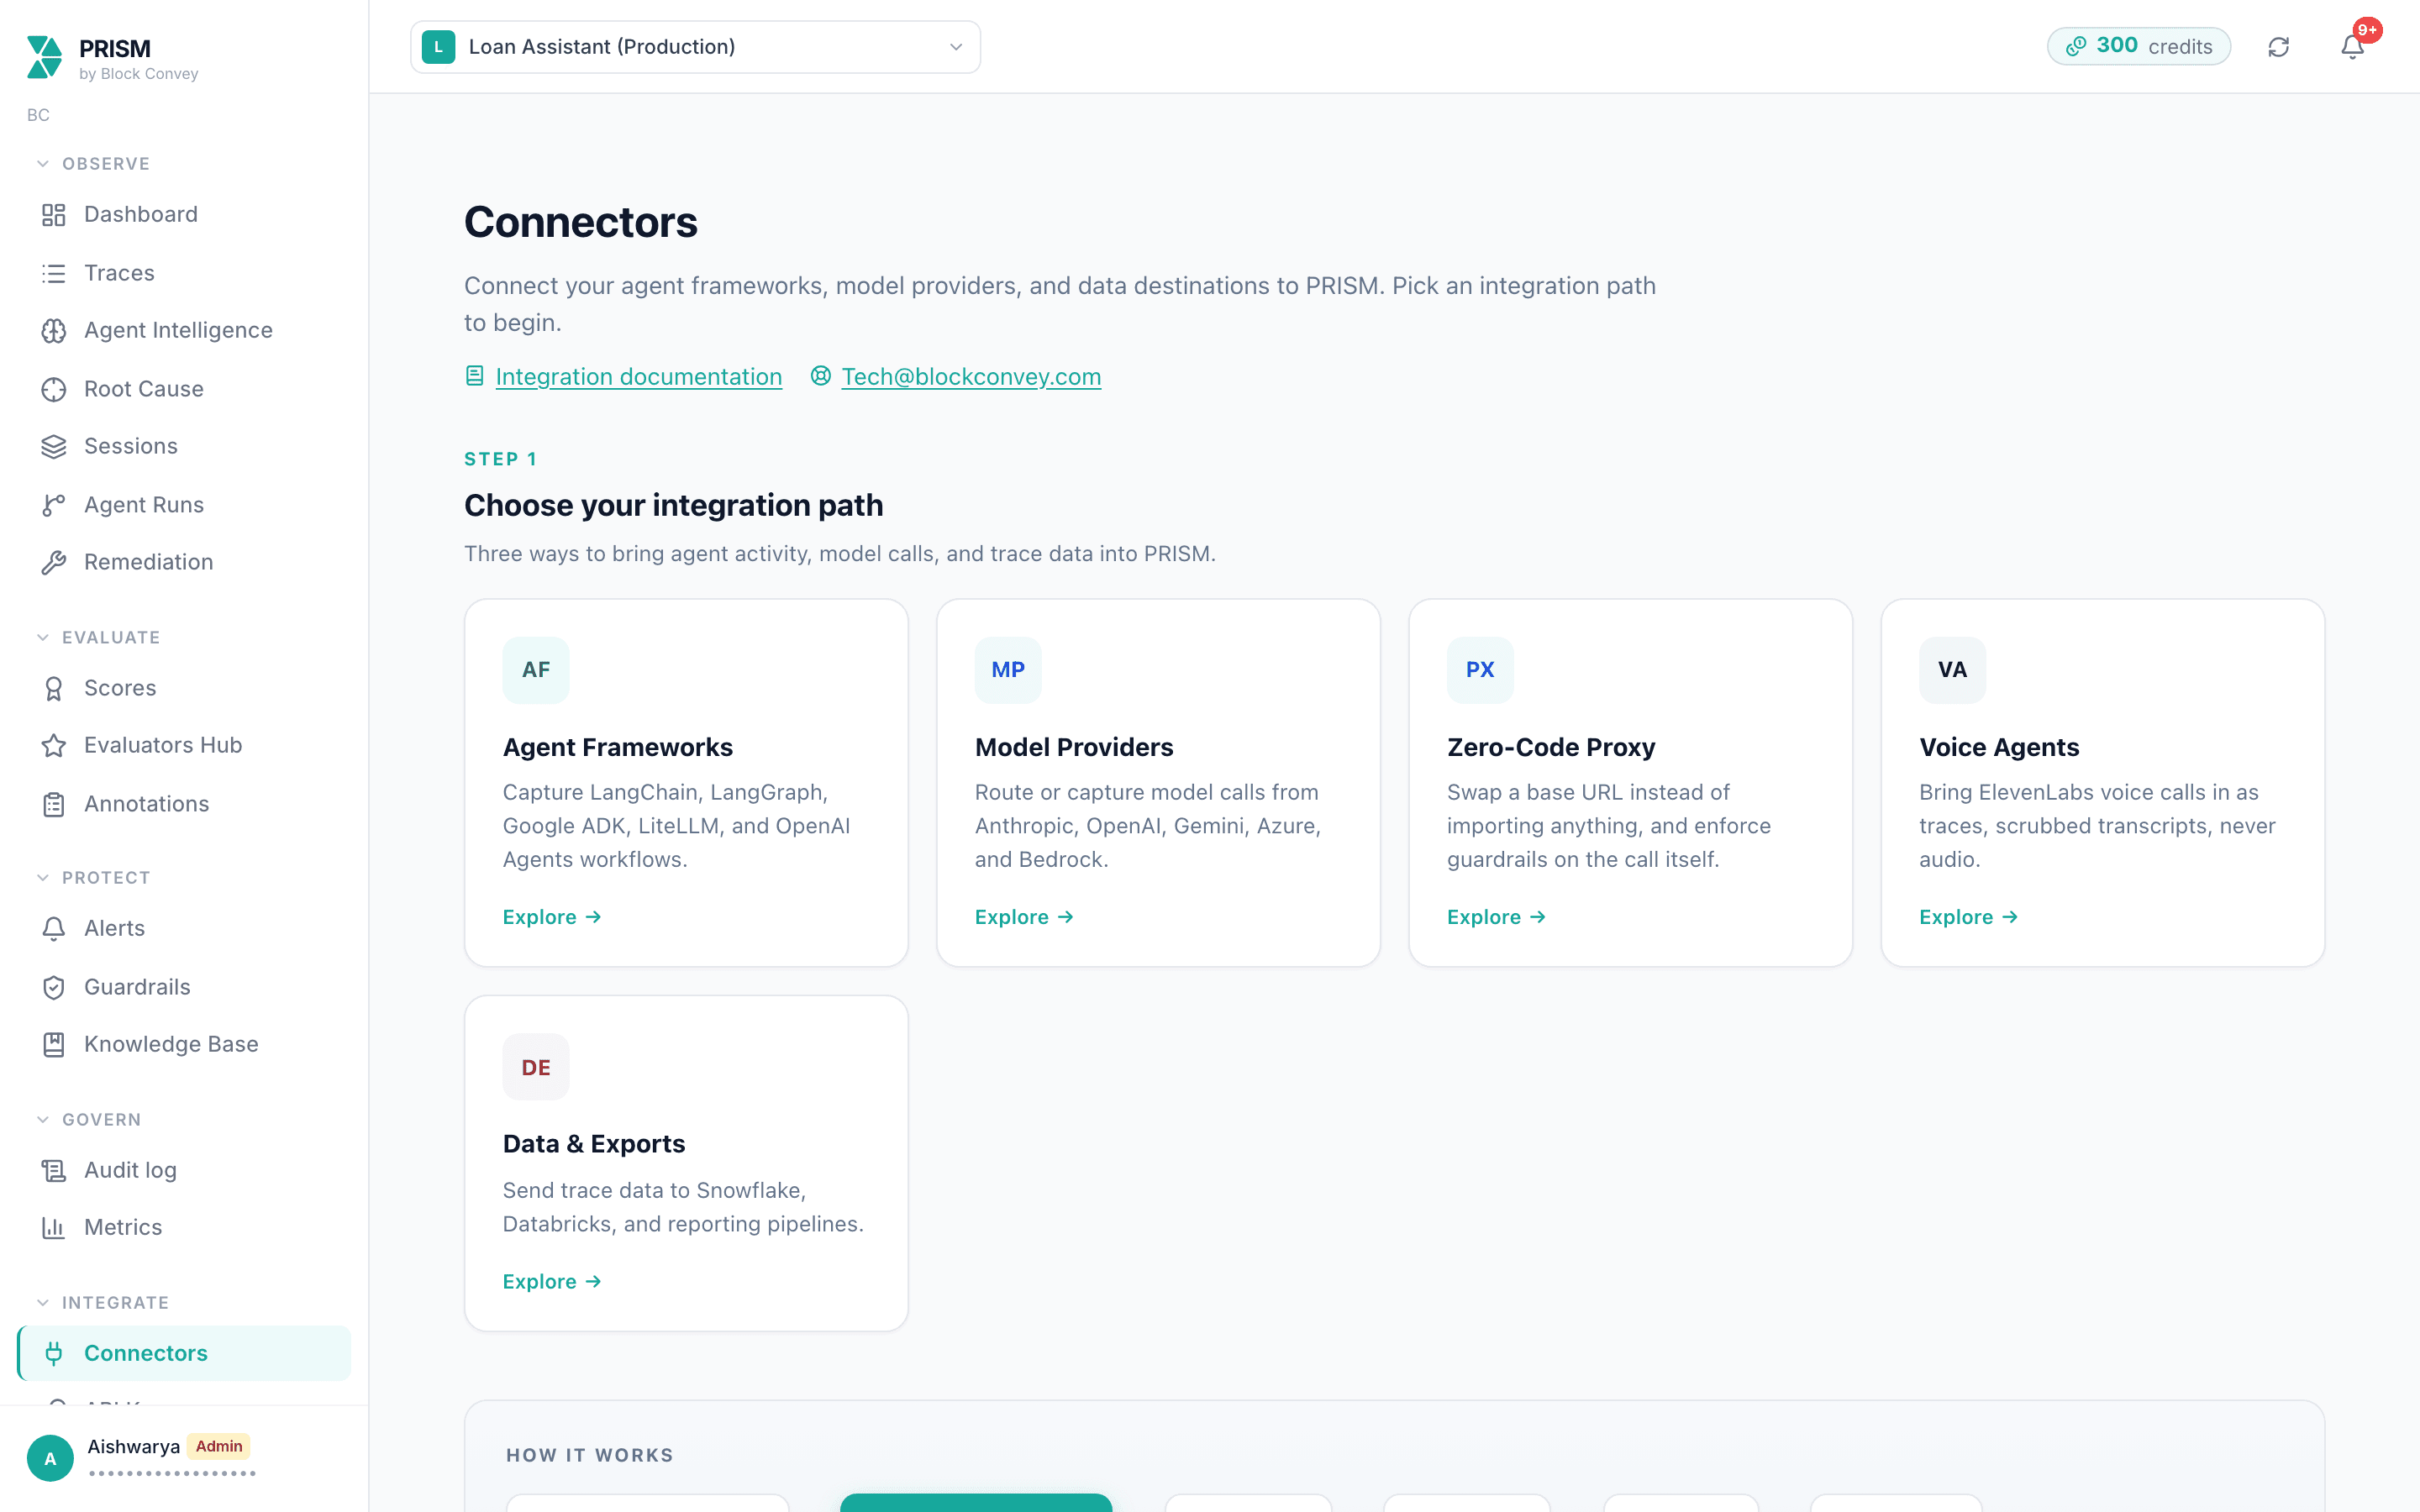
Choosing a Path
Four ways in. You need one.
| Path | You change | You capture | Use when |
|---|---|---|---|
| Python SDK | Attach a handler to your framework | Full trajectories: model calls, tool calls, retrieval, handoffs, errors | Your app is Python and uses LangChain, LangGraph, Google ADK, LiteLLM, or the OpenAI Agents SDK. |
| Zero-code proxy | One base URL in your client config | Model-level: prompts, completions, latency, tokens, plus inline guardrails | You call Anthropic, OpenAI, or Gemini directly, in any language. |
| OpenTelemetry | Two environment variables | Whatever your existing spans carry, read through the GenAI conventions | You already run an OpenTelemetry exporter, in any language. No PRISM SDK. |
| HTTP | One POST after each response | One trace per exchange, plus whatever metadata you attach | Anything else: TypeScript, Go, Java, or a framework the SDK does not cover. |
Python SDK
The distribution is prismtrace-sdk; the import package is prismtrace. Install one, import the other.
pip install "prismtrace-sdk>=0.4.3"The current release is 0.5.0. The floor stays at 0.4.3, where prismtrace.session and handler.close() arrived; reading a framework's own conversation id, described under LangGraph below, needs 0.5.0.
LangChain
import os
import prismtrace
from prismtrace import PRISMtraceCallbackHandler
from langchain_anthropic import ChatAnthropic

# Build the handler once, at startup, and share it. It holds an HTTP
# connection pool, and one handler per conversation leaks one pool per
# conversation.
handler = PRISMtraceCallbackHandler(
    api_key=os.environ["PRISMTRACE_API_KEY"],
    project_id=os.environ["PRISMTRACE_PROJECT_ID"],
    host=os.environ["PRISMTRACE_HOST"],
    agent_name="loan-assistant",
)

llm = ChatAnthropic(model="claude-sonnet-4-6", callbacks=[handler])

with prismtrace.session("conversation-1"):   # one value per conversation
    ...  # run your chain or agent

handler.close()   # at shutdown, not per conversation; flushes first
LangGraph — wrap_langgraph injects the callbacks on invoke and stream, so you do not repeat the config at every call site.
import os
import prismtrace
from prismtrace import PRISMtraceLangGraphHandler, wrap_langgraph

handler = PRISMtraceLangGraphHandler(
    api_key=os.environ["PRISMTRACE_API_KEY"],
    project_id=os.environ["PRISMTRACE_PROJECT_ID"],
    host=os.environ["PRISMTRACE_HOST"],
    agent_name="my-graph",
)

graph = wrap_langgraph(compiled_graph, handler)

with prismtrace.session("graph-run-1"):
    graph.invoke({"messages": [("user", "hello")]})

handler.close()
A graph that already passes thread_id needs no session block. From SDK 0.5.0 the handler reads the conversation id the framework was already given, so graph.invoke(state, config={"configurable": {"thread_id": tid}}) groups every turn of one thread onto one session. The same applies to Google ADK's Runner.run(session_id=...). The precedence is fixed: an explicit session_id= on the handler wins, then an open prismtrace.session(...), then the framework's id, then an anonymous per-handler id that groups nothing. Each trace records which of those answered as sdk.session_origin in its metadata, so a conversation that did not group can be diagnosed without reading the application's source.
Google ADK — multi-agent handoffs are recorded as handoff steps, so delegation between sub-agents shows in the trajectory instead of collapsing into one opaque run.
import os
from prismtrace import PRISMtraceADKAdapter
from google.adk.agents import LlmAgent

adapter = PRISMtraceADKAdapter(
    api_key=os.environ["PRISMTRACE_API_KEY"],
    project_id=os.environ["PRISMTRACE_PROJECT_ID"],
    agent_name="my-adk-agent",
)

agent = LlmAgent(
    model="gemini-3.6-flash",
    instruction="You are a helpful assistant.",
    before_model_callback=adapter.before_model,
    after_model_callback=adapter.after_model,
    before_tool_callback=adapter.before_tool,
    after_tool_callback=adapter.after_tool,
    before_agent_callback=adapter.before_agent,
    after_agent_callback=adapter.after_agent,
)LiteLLM — one call at startup traces every model LiteLLM routes to, through a single hook.
import os, litellm
from prismtrace import install_litellm

install_litellm(
    api_key=os.environ["PRISMTRACE_API_KEY"],
    project_id=os.environ["PRISMTRACE_PROJECT_ID"],
)

response = litellm.completion(
    model="gpt-4o",
    messages=[{"role": "user", "content": "hello"}],
)
OpenAI Agents SDK
import os
from agents import Agent, Runner
from prismtrace import install_openai_agents

install_openai_agents(
    api_key=os.environ["PRISMTRACE_API_KEY"],
    project_id=os.environ["PRISMTRACE_PROJECT_ID"],
)

agent = Agent(name="my-agent", instructions="...")
result = await Runner.run(agent, "hello")TypeScript and JavaScript
Instrument your chat handler, or the completion callback of generateText / streamText, so each turn emits one trace. On serverless, await the call so the function is not frozen mid-request.
const HOST = process.env.PRISMTRACE_HOST!;
const API_KEY = process.env.PRISMTRACE_API_KEY!;
const PROJECT_ID = process.env.PRISMTRACE_PROJECT_ID!;

export async function emitTrace(
  input: string,
  output: string,
  opts: { model: string; latencyMs: number; sessionId?: string },
) {
  const res = await fetch(HOST + "/api/traces", {
    method: "POST",
    headers: {
      "Content-Type": "application/json",
      "X-PRISMtrace-Key": API_KEY,
    },
    body: JSON.stringify({
      project_id: PROJECT_ID,
      model: opts.model,
      input_messages: [{ role: "user", content: input }],
      output_message: output,
      latency_ms: opts.latencyMs,
      session_id: opts.sessionId,
    }),
  });
  if (!res.ok) {
    throw new Error("PRISM ingest " + res.status + ": " + (await res.text()));
  }
}
OpenTelemetry
If your service is already instrumented with OpenTelemetry, point the exporter you already run at PRISM. Nothing to install, no PRISM SDK, and it works from any language with an OTel SDK.
OTEL_EXPORTER_OTLP_ENDPOINT=https://prism.blockconvey.com/api/otlp
OTEL_EXPORTER_OTLP_PROTOCOL=http/protobuf
OTEL_EXPORTER_OTLP_HEADERS=X-PRISMtrace-Key=pt-sk-...
Do not add /v1/traces yourself. The OTLP specification appends the signal path to the endpoint, so the value above resolves to POST /api/otlp/v1/traces on its own.
Your API key identifies the project, so nothing in the payload needs to name one. Attributes are read through the OpenTelemetry GenAI semantic conventions, so instrumentation that already emits gen_ai.request.model, gen_ai.usage.input_tokens and gen_ai.conversation.id needs no further change.
Multi-turn conversations group only when you declare a session. PRISM groups OTLP spans into a trace by the OpenTelemetry trace id, and standard GenAI instrumentation starts a new trace per turn, so a three-turn conversation arrives as three traces. They are stitched into one session only when the payload carries gen_ai.conversation.id, session.id or prismtrace.session_id, read from span attributes first and then from resource attributes. PRISM never guesses: an inferred session could merge unrelated users' conversations. Without one of those attributes there is no multi-turn trajectory, so nothing spans turns in the Evaluation tab. When traces arrive without one, the export response carries the X-PRISMtrace-Sessionless-Traces header.
Which line to set depends on the framework:
- OpenInference (LangChain, CrewAI, LlamaIndex, ADK and around thirty
others): set session.id with using_session(), or put session_id, conversation_id or thread_id in the LangChain run metadata=. The instrumentor reads run metadata, first match wins.
- LangGraph:
config["configurable"]["thread_id"]is enough, because
LangGraph copies thread_id into run metadata itself. A plain LangChain Runnable does not, so a bare chain needs the id in metadata= as well. Passing it in metadata= works on both.
- openllmetry / Traceloop: set its
conversation_id, which the SDK writes
to gen_ai.conversation.id. If the id lives in an association property such as traceloop.association.properties.chat_id, name that key in the project setting below instead of renaming it upstream.
- Google ADK, agno on third-party OTel instrumentation: the runner's
session_id is not promoted to a span attribute, so set prismtrace.session_id as a resource attribute on the exporter. On the PRISM SDK adapter nothing is needed; it reads ADK's session itself.
- Anything else: set
prismtrace.session_id, or name the attribute the id
already lives at.
If your instrumentation carries the id under a non-standard key, set otlp_session_attribute on the project (PATCH /api/projects/{id}) to that key. It is consulted only when none of the three standard attributes is present, so it adds grouping and never overrides a conversation id declared conventionally, and it cannot help when the framework never put the id on the span at all.
Zero-Code Proxy
Point your existing provider client at PRISM instead of the provider. Nothing is imported and no call site changes. PRISM forwards the call, records it, and runs your guardrails in both directions. It adds one network hop, roughly 5 to 15 ms depending on region.
Three providers are proxied. Each client wants the base URL in a slightly different shape.
import anthropic, os

client = anthropic.Anthropic(
    api_key=os.environ["ANTHROPIC_API_KEY"],
    base_url="https://prism.blockconvey.com/proxy/anthropic",
    default_headers={"X-PRISMtrace-Key": os.environ["PRISMTRACE_API_KEY"]},
)

# OpenAI  ->  base_url="https://prism.blockconvey.com/proxy/openai/v1"
# Gemini  ->  client_options={"api_endpoint": "https://prism.blockconvey.com/proxy/gemini"}
Azure AI Foundry uses the OpenAI proxy route with your resource passed as an x-azure-endpoint header. AWS Bedrock does not use the proxy: it connects with stored AWS credentials from the Connectors page.
Voice Agents
A voice agent has no LLM call site to wrap, so PRISM hooks the voice platform. Each ElevenLabs call becomes one trajectory: caller speech is a speech-to-text step, the agent reply is a text-to-speech step. Transcripts are scrubbed for PII on the server before storage, and audio is never sent to or stored by PRISM.
- Post-call webhook. No code. Point ElevenLabs at the webhook URL on the
connector card and subscribe to post_call_transcription only. Do not enable post_call_audio; PRISM rejects it. Store the ElevenLabs signing secret on the connector so deliveries are verified against your project.
- Live tracing. Calls appear while they are still in progress.
import os
from elevenlabs.client import ElevenLabs
from elevenlabs.conversational_ai.conversation import Conversation
from elevenlabs.conversational_ai.default_audio_interface import DefaultAudioInterface
from prismtrace import PRISMtraceVoiceTracer

tracer = PRISMtraceVoiceTracer(
    api_key=os.environ["PRISMTRACE_API_KEY"],
    project_id=os.environ["PRISMTRACE_PROJECT_ID"],
    agent_name="Support line",
)

conversation = Conversation(
    ElevenLabs(api_key=os.environ["ELEVENLABS_API_KEY"]),
    AGENT_ID,
    requires_auth=True,
    audio_interface=DefaultAudioInterface(),
    **tracer.callbacks(),
)

conversation.start_session()
tracer.finalize(conversation.wait_for_session_end())
Warehouses and Export
Connect Snowflake or Databricks from the Connectors page with stored warehouse credentials, then sync on demand. Data Export downloads traces, scores, annotations, conversations, and alerts as CSV. Import Traces back-fills history from an existing log so you are not starting from an empty dashboard.
API Reference
Base URL: https://prism.blockconvey.com
Authentication
Machine callers authenticate with the X-PRISMtrace-Key header. This is not a bearer token: Authorization: Bearer carries dashboard sessions and will be rejected for an API key.
X-PRISMtrace-Key: pt-sk-...Keys carry scopes. Give an application only what it needs.
| Scope | Allows |
|---|---|
ingest | Sending traces and spans. This is what your application should carry. |
read | Reading traces, analyses, and balances back out. |
operate | Triggering actions that spend credits. |
A key can be rotated with a grace period, so the old one keeps working while you roll out the new one, then revoked. Both are on the API keys page.
Create a Trace
POST https://prism.blockconvey.com/api/traces
{
  "project_id": "00000000-0000-0000-0000-000000000000",
  "model": "claude-sonnet-4-6",
  "input_messages": [
    { "role": "user", "content": "What loan rates do you offer?" }
  ],
  "output_message": "Our personal loan rates currently start at 7.9% APR.",
  "latency_ms": 420,
  "token_count_input": 45,
  "token_count_output": 180,
  "session_id": "conversation-1",
  "user_identifier": "user-4521",
  "agent_id": "loan-assistant",
  "agent_name": "Loan Assistant",
  "metadata": { "source": "production" }
}| Field | Type | Required | Description |
|---|---|---|---|
project_id | string | Yes | Project UUID, from Settings → Project. |
model | string | Yes | Model name. Drives per-model cost and latency breakdowns. |
input_messages | array | Yes | Objects of {role, content}. |
output_message | string | Yes | The agent reply. |
latency_ms | int | Yes | Response time. Send 0 if you are not measuring it. |
session_id | string | No | Groups traces into one conversation or run. Without it, traces never assemble into a session. |
agent_id | string | No | Stable agent identifier. Matched by Model Inventory and agent-scoped alert rules. |
agent_name | string | No | Display name for the agent. |
user_identifier | string | No | Your identifier for the end user. |
trace_id | string | No | Your own id for this trace. Re-sending the same one returns the existing trace instead of duplicating it. |
token_count_input | int | No | Defaults to 0. Used for cost. |
token_count_output | int | No | Defaults to 0. Used for cost. |
metadata | object | No | Free-form. Filterable in the dashboard. |
Returns 200 with the stored trace: its id, the resolved cost_usd, and the session_id it was filed under.
Diagnostics
| Endpoint | Purpose |
|---|---|
POST /api/setup-doctor/handshake | Proves a credential and optionally stores one test trace. Always authenticates and returns a specific reason on failure. Body: {project_id, send_test_trace}. |
GET /api/setup-doctor | Reports pipeline state for a project: live_connected, per-stage status, and blocked_step. Query: project_id. |
Usage and Credits
| Endpoint | Returns |
|---|---|
GET /api/credits/summary | Balance, per-source breakdown, current cycle, renewal date, and whether spending is paused. |
GET /api/credits/ledger | Every credit movement, with the capability that caused it. |
GET /api/credits/catalog | The price of every metered action, and what one unit buys. |
GET /api/entitlements | Your plan, its features, its numeric limits, and how each limit is enforced. |
GET /api/entitlements/usage | Current usage against each limit. |
Errors and Limits
| Status | Meaning | What to do |
|---|---|---|
401 | Missing or invalid credential. The response body names which. | Check the header name and that the key was not revoked. |
403 | The key is valid but belongs to a different project, or lacks the scope for this call. | Use the project ID named in the message, or a key with the right scope. |
402 | Either the credit balance cannot cover this action, or the feature is not on your plan. | Read error: insufficient_credits carries the price and balance; plan_limit_reached names the limit. |
404 | No such project. | Re-check the project ID. |
429 | Rate limited. Each ingest endpoint allows 2,000 requests per minute. | Back off and retry, or batch. |
Platform
Traces, Sessions, and Runs
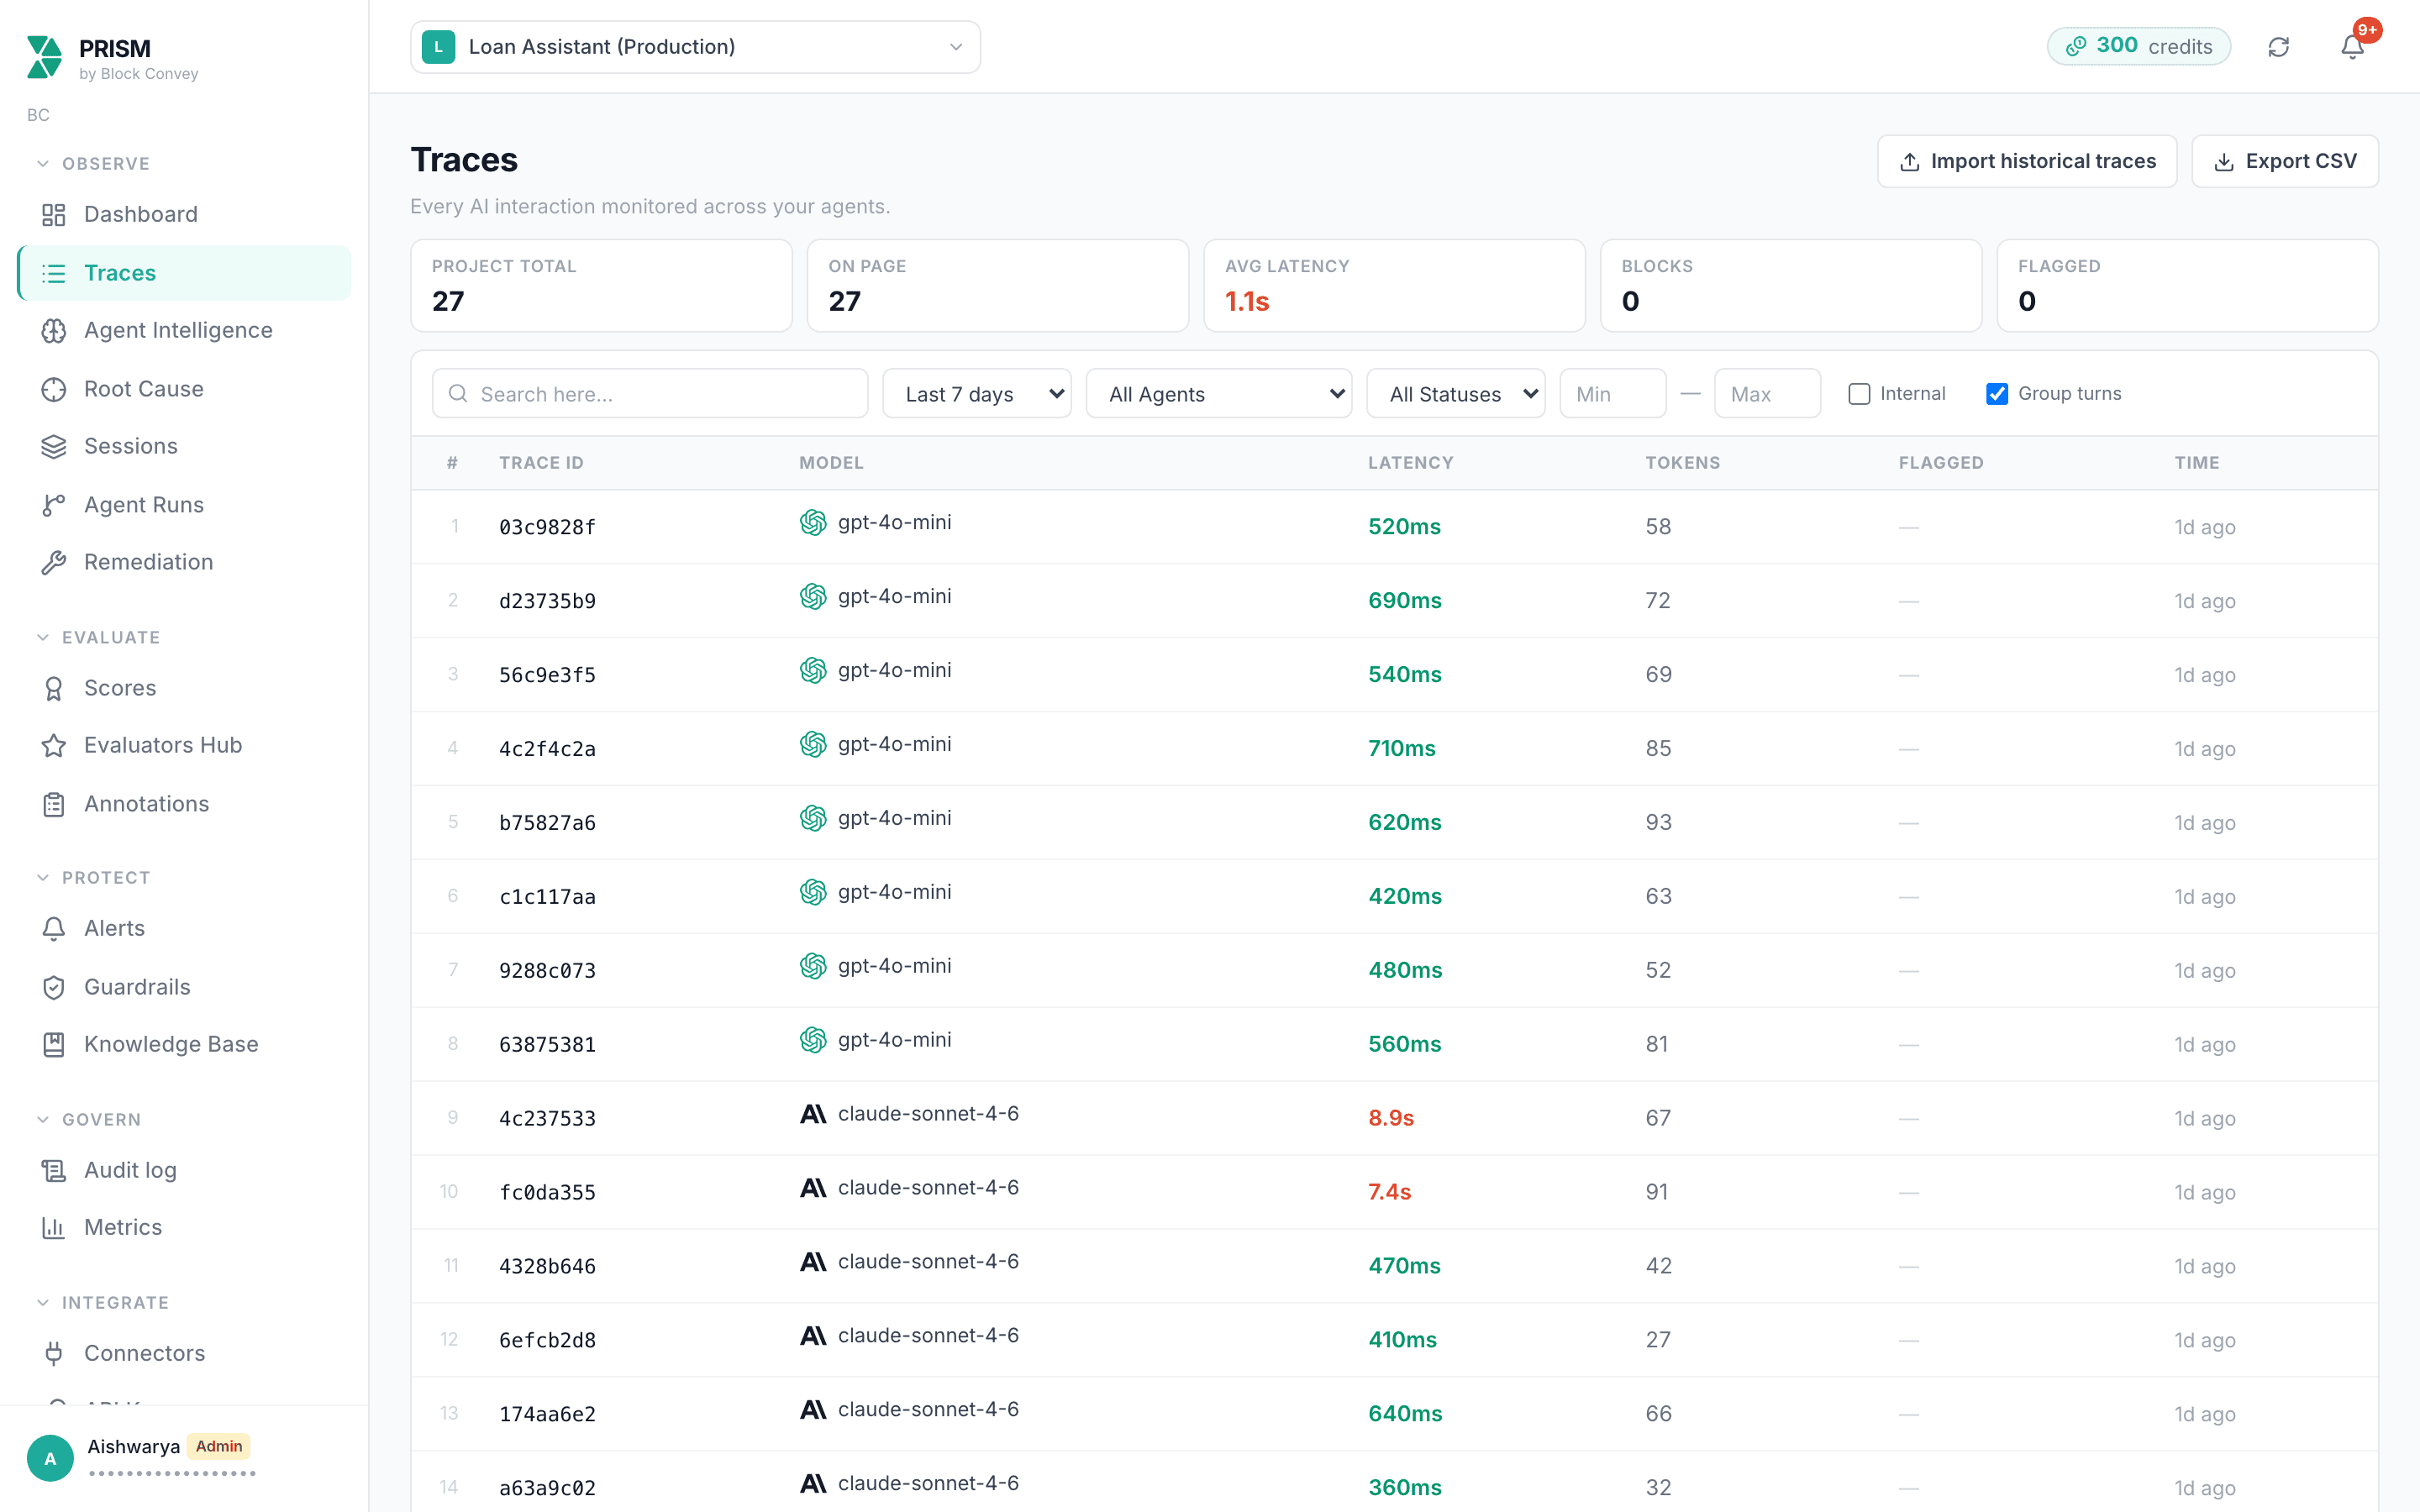
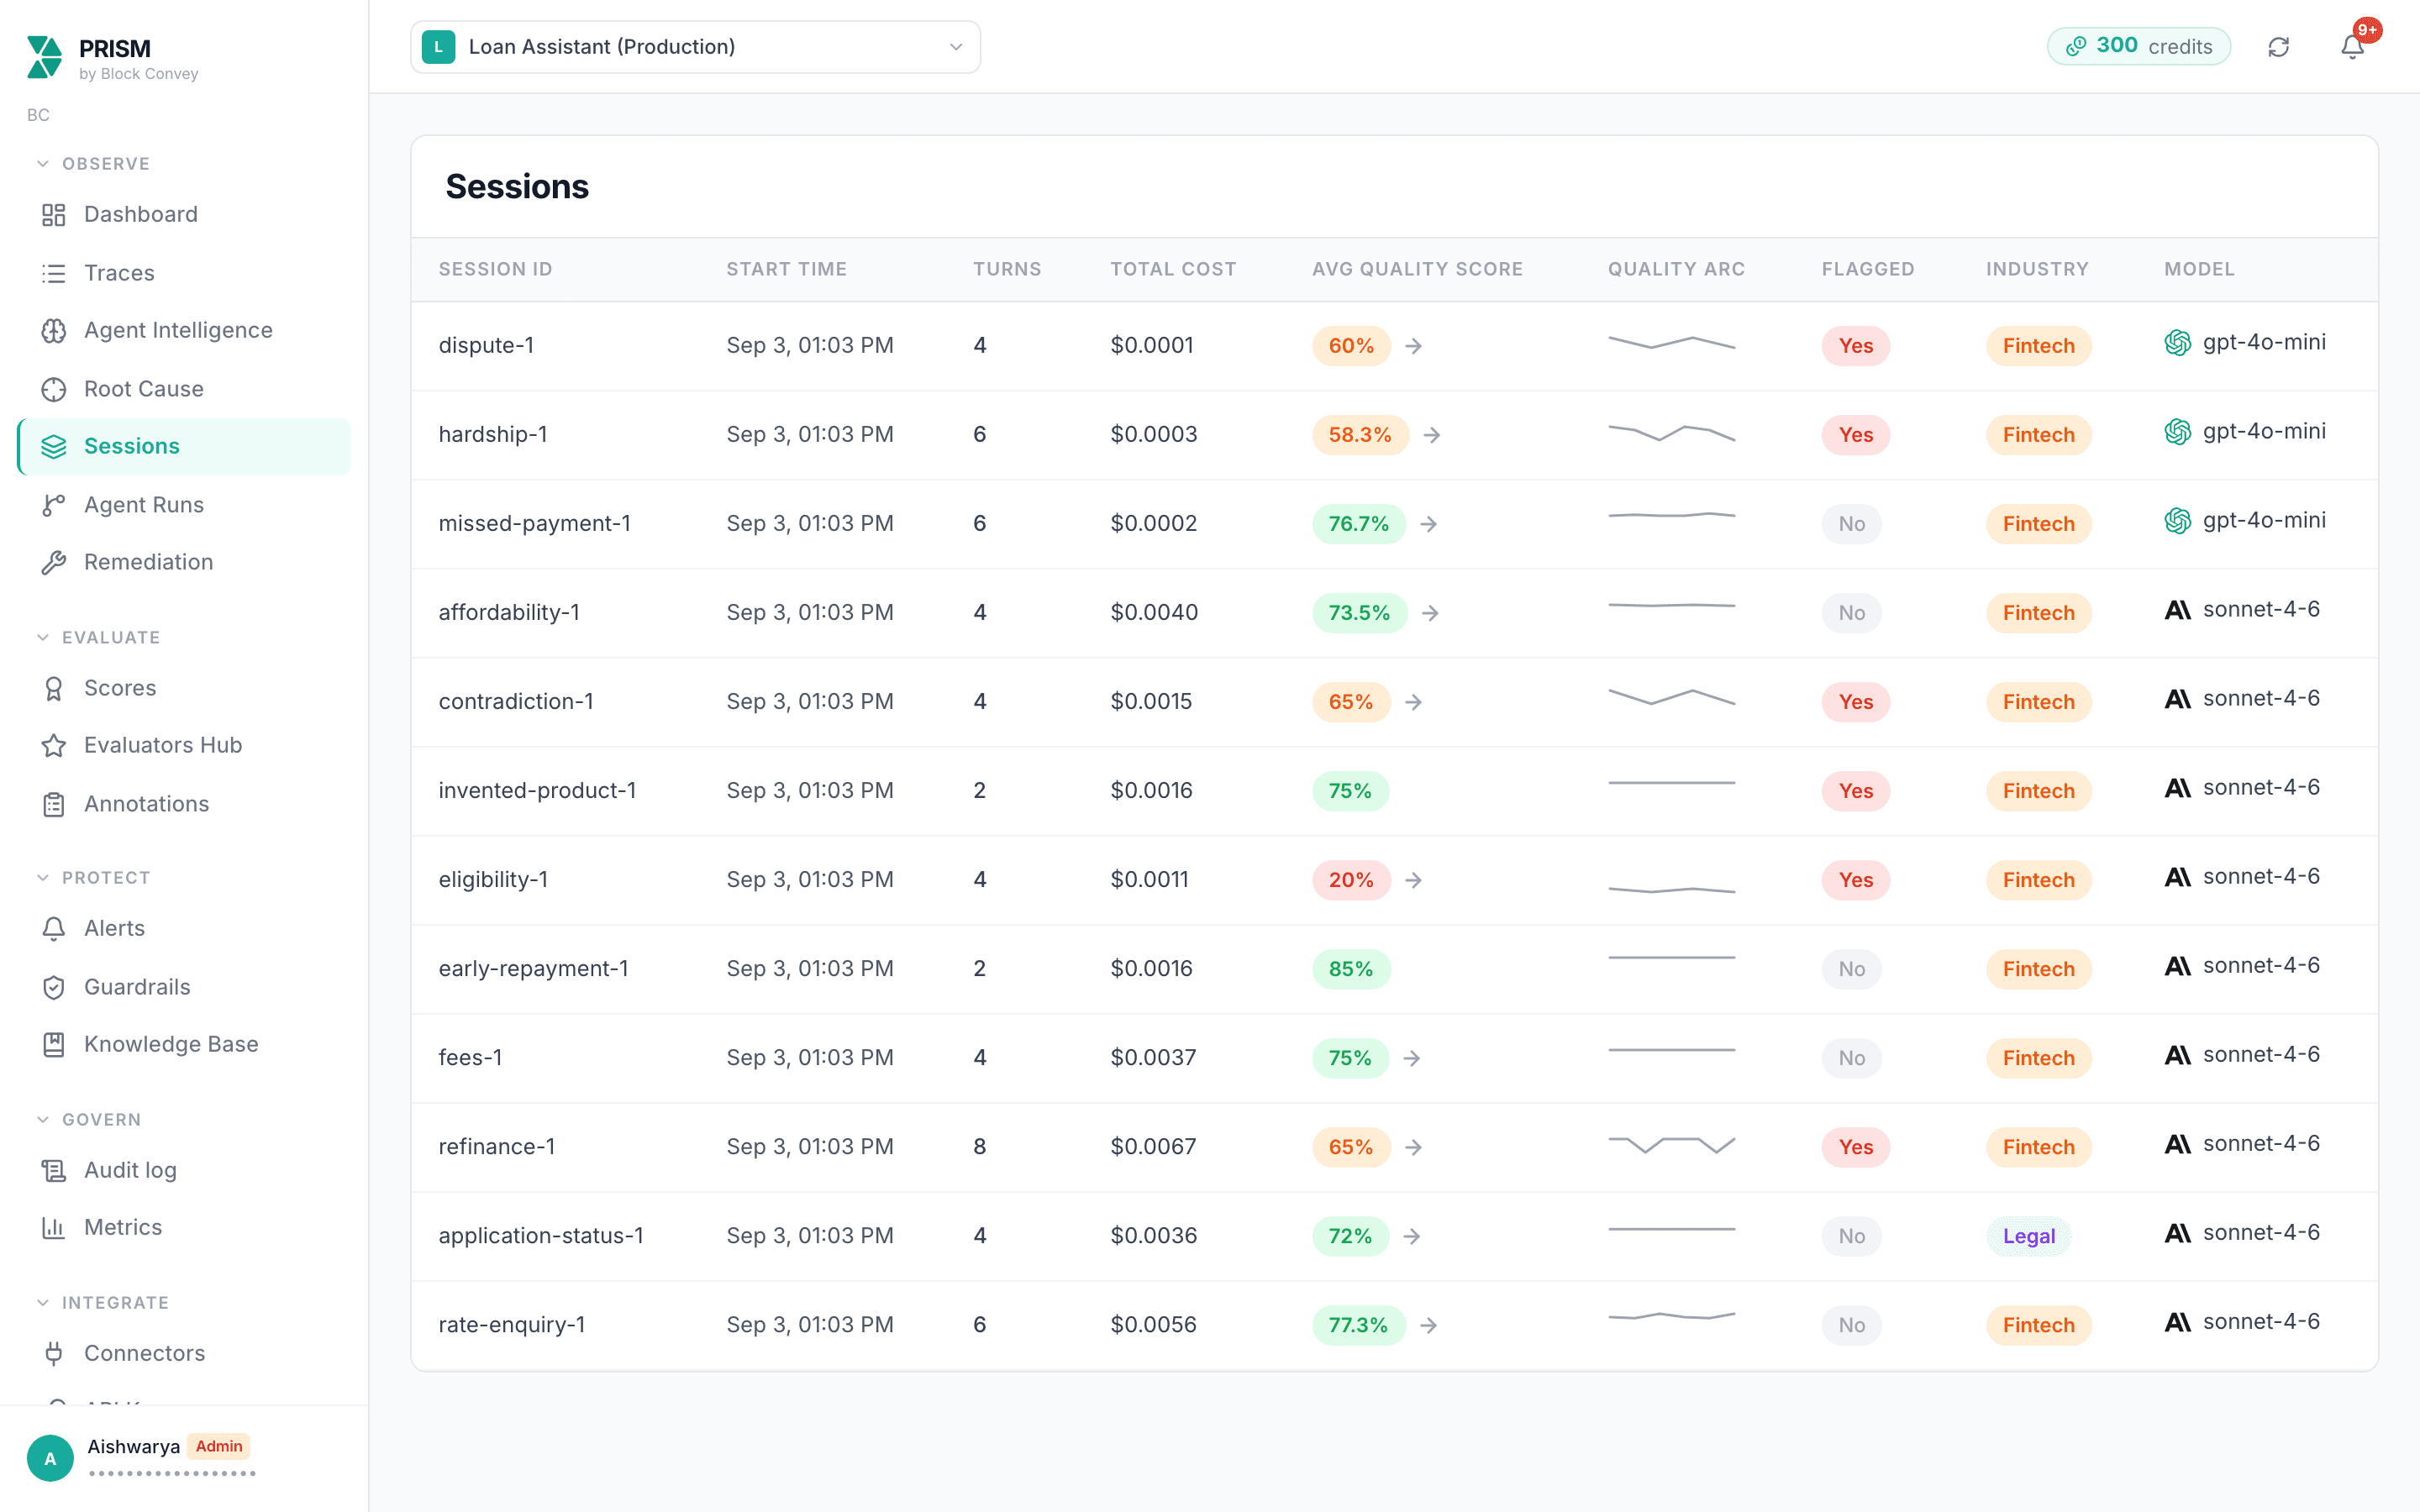
Click any trace for the full conversation, the automatic analysis, the trajectory steps, and any guardrail flags. Above the list, Sessions groups traces sharing a session_id (on the OpenTelemetry path, a declared session attribute; PRISM never infers one) so a conversation reads end to end, and Agent Runs shows the trajectory inside a single run: which model was called, which tools fired, where a handoff happened, and where it failed.
Model Inventory fills itself from the agent_id and model on your traces. There is nothing to register by hand; send a trace and the agent appears, with trace count, average latency, last activity, and provider. Sending a stable agent_id is what stops one agent splitting into several entries.
Automatic Scoring
Every trace is analysed on arrival. This costs no credits and happens whether or not you ask for it. Each plan has a daily ceiling on it: 100 analyses on Free and 200 on Builder. Past the ceiling, traces are still stored and the deterministic checks still run; the LLM scoring pauses until 00:00 UTC and can be run on demand from Agent Intelligence for one credit per trace. The notification bell tells you once when a day reaches the ceiling.
| Score | Range | What it measures |
|---|---|---|
| Customer satisfaction | 0–100 | How satisfied the user would likely feel with this response. Alert rules read this as compliance_score. |
| Response quality | 0–100 | Accuracy, helpfulness, and clarity of the reply. |
| Intent detected | label | What the user was trying to accomplish. Filterable and groupable. |
| Flagged for review | boolean | Set when either score is below 40, the reply looks like a hallucination, the user seems very frustrated, or the conversation contradicts itself. Carries a one-line reason. |
PRISM also detects the industry of a conversation and applies extra checks on top: rate promises and regulated-activity flags for financial conversations, PHI exposure and unsafe medical advice for healthcare, and privilege risk for legal.
Guardrails
Every rule has an action, flag or block, and takes effect on save with no deployment step. Ten rule types are available.
| Rule type | Catches | Severity |
|---|---|---|
| PII / PHI Detection | Personally identifiable and protected health information | Critical |
| Prompt Injection | Adversarial prompts overriding agent instructions | Critical |
| Content Moderation | Inappropriate or policy-violating content | High |
| Toxicity Detection | Toxic and harmful language in responses | High |
| Secrets Detection | API keys, passwords, and other secrets in output | High |
| Code Safety Linter | Unsafe patterns in generated code | Medium |
| SQL Sanitizer | SQL injection patterns in user input | Medium |
| Regex Pattern Match | Your own patterns: account numbers, internal codes | Medium |
| Off-Topic Detection | Queries outside the agent scope, optionally grounded in your Knowledge Base | Medium |
| Language Restriction | Input or output outside the languages you allow | Medium |
Where to start
- PII / PHI on flag. Watch what it catches on your own traffic for a few days, then switch to block once you trust it.
- Prompt Injection on block. There is no legitimate reason for a user to override your agent instructions.
- Secrets Detection on block if your agent can see configuration, infrastructure, or code.
Alerts
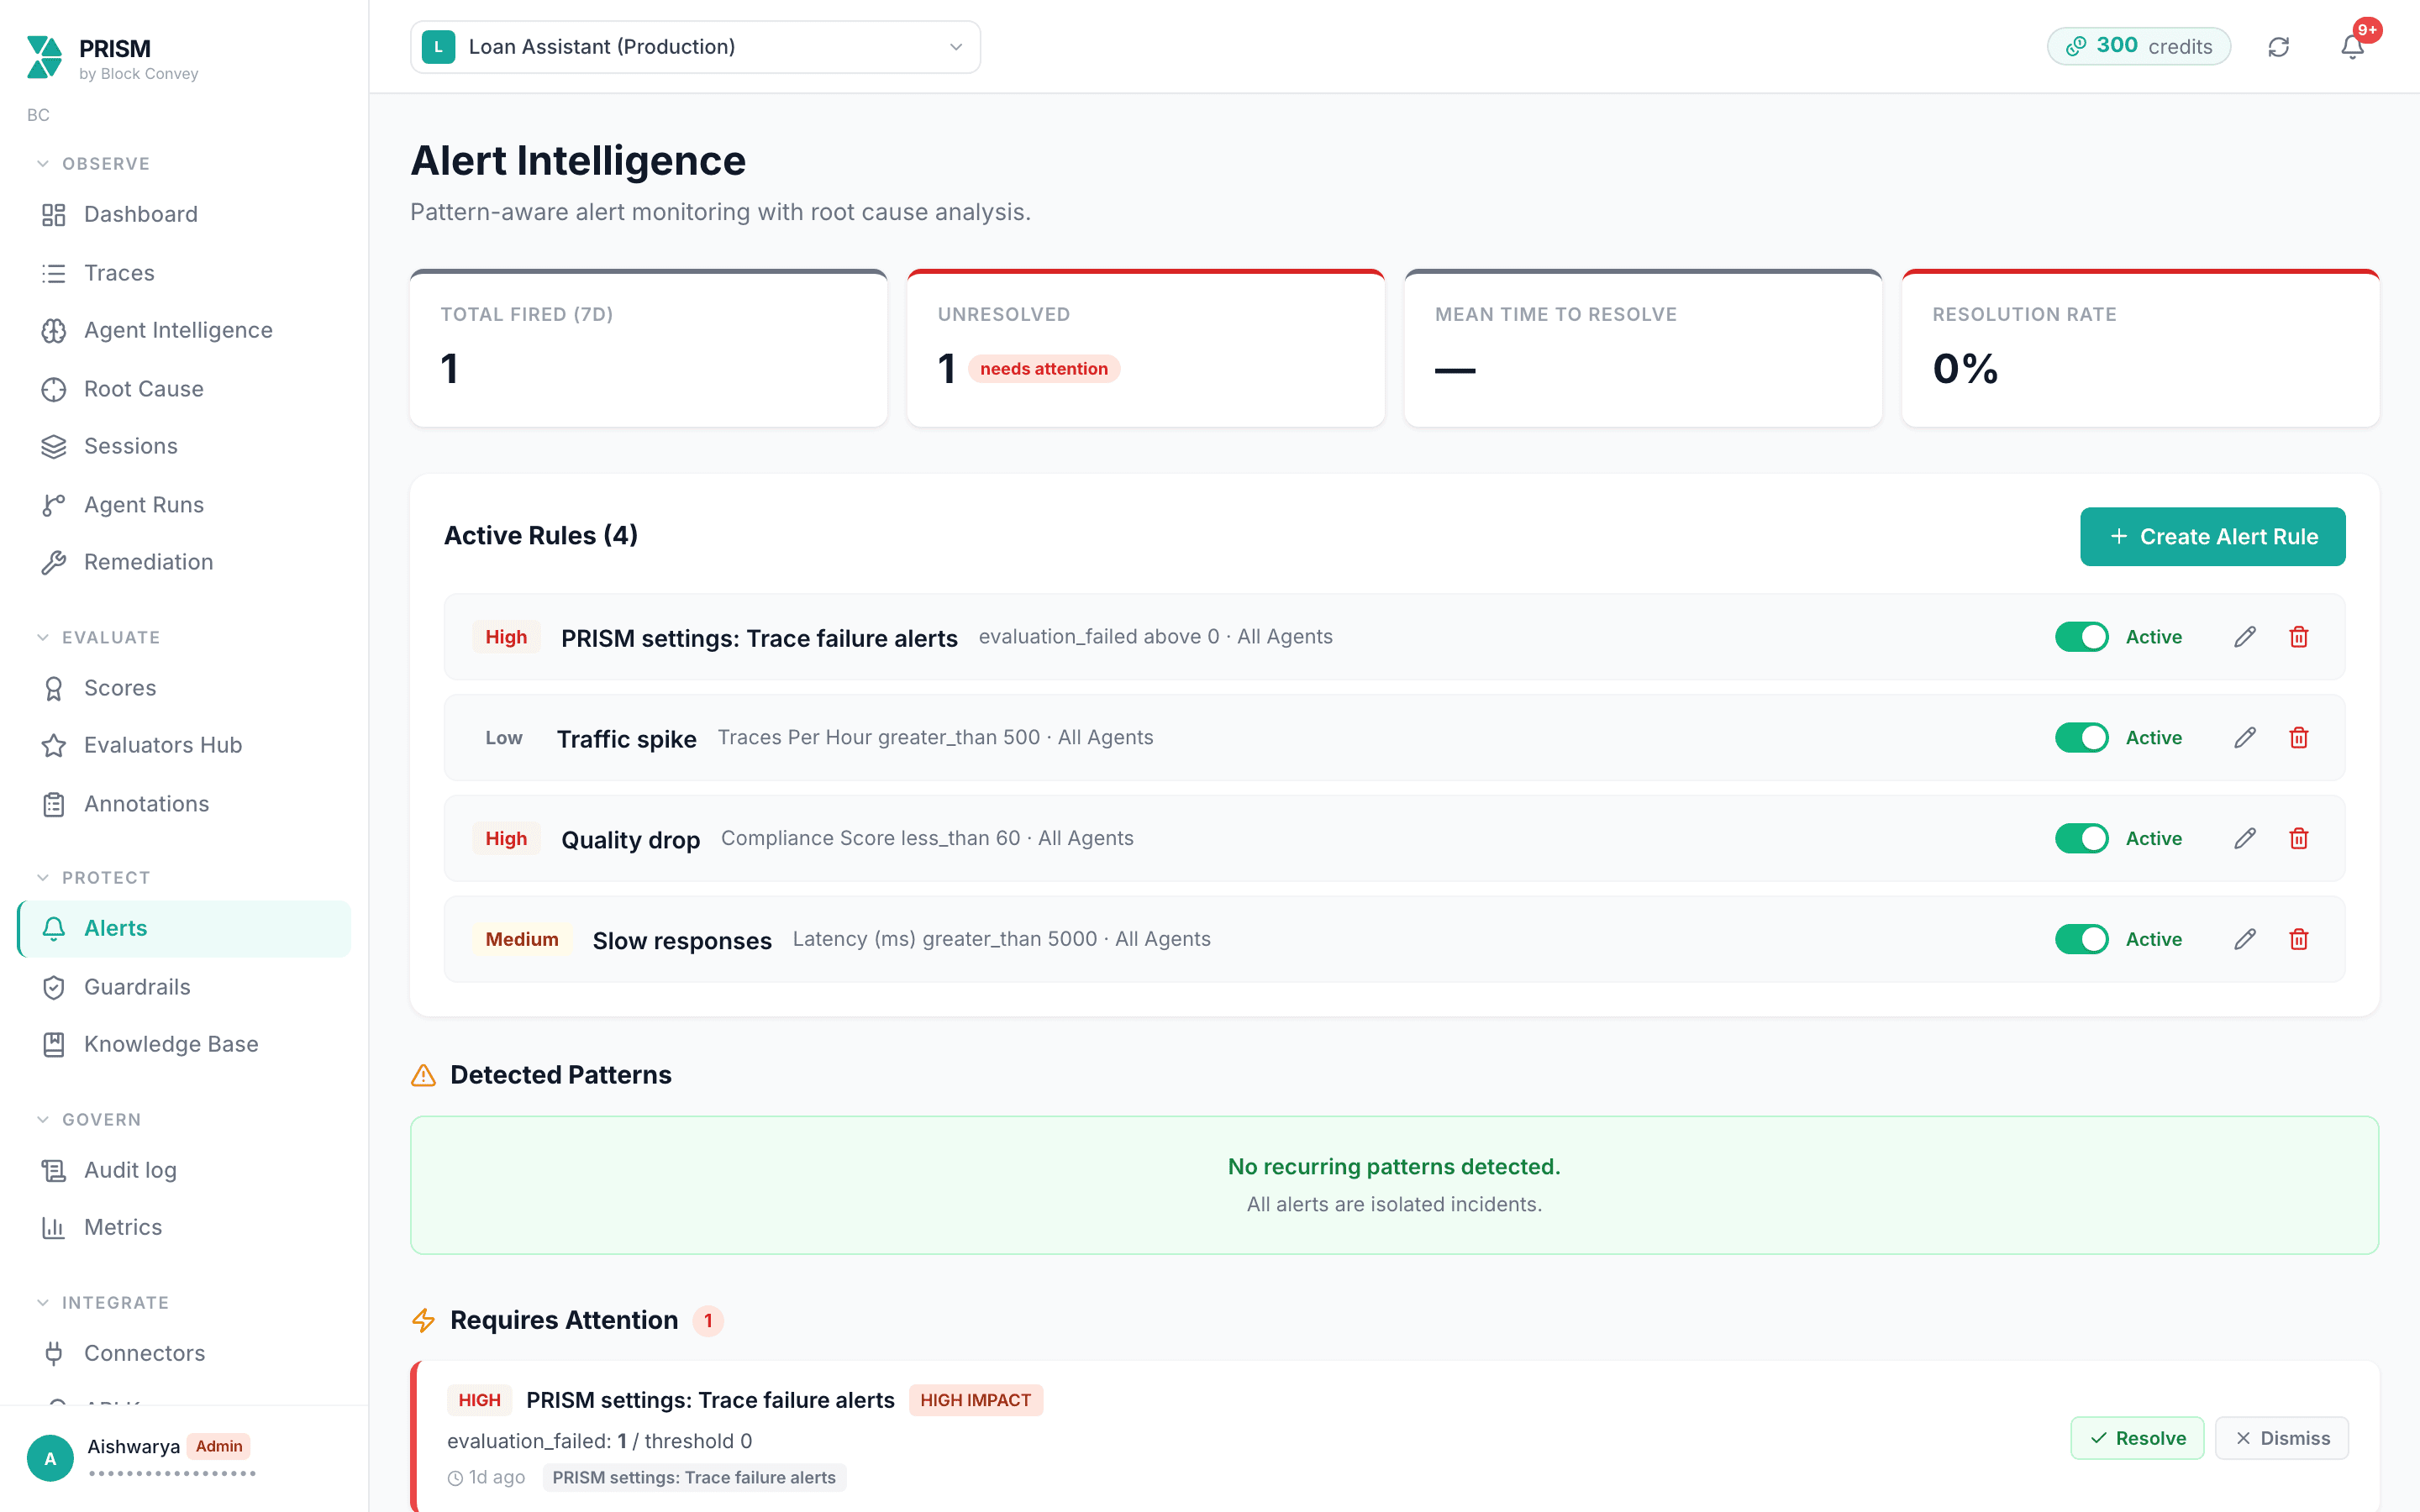
A rule is a metric, a condition, a threshold, and a severity, optionally scoped to one agent. Give it a notification email and PRISM writes there when the rule fires. Fired alerts can be resolved or dismissed, and repeated firings are grouped into patterns so a recurring problem reads as one thing rather than forty. Alerts are available on Free and Builder alike.
| Metric | Measures | Typical rule |
|---|---|---|
latency | Response time of the trace, in milliseconds | Above 5000 |
compliance_score | The customer-satisfaction score from automatic analysis | Below 60 |
error_rate | Percentage of traces in the trailing hour with no output | Above 5 |
traces_per_hour | Trace volume in the trailing hour | Below 1, to catch an agent that has gone silent |
guardrail_blocks | Guardrail blocks in the window | Above 10, to catch an attack or a bad rule |
evaluation_failed | Traces automatic analysis could not evaluate | Above 0 |
Root Cause and Remediation
Root Cause clusters failing traces into recurring problems and traces each back toward the prompt or code responsible, rather than leaving you to read failures one at a time. Remediation turns those clusters into concrete recommendations. Agent Intelligence sits above both, summarising a window of traffic in prose and naming the failure themes inside it.
Plans and Credits
Two separate things govern what your account can do. Plan limits are capacity: how much you can store and for how long. Credits meter the AI actions you deliberately trigger. Neither ever hides data you have already captured.
Free and Builder
Free is the complete core product, not a trial. Traces, sessions, agent runs, automatic scoring, alerts, root cause, remediation, Knowledge Base, Model Inventory, connectors, and export all work on Free. Builder raises the ceilings and adds three capabilities: Guardrails, the Evaluators Hub with its annotation queues, and the expanded Model Inventory.
| Free | Builder | At the ceiling | |
|---|---|---|---|
| Traces per month | 25,000 | 250,000 | Counted, warned about at 80% and 100%. Traces are still stored. One agent turn counts once: rows that share a multi-agent framework's invocation id are a single unit, up to 20 rows per turn. |
| Distinct models | 5 | 20 | Counted and warned about. Traces are still stored. |
| Data retention | 14 days | 90 days | Older traces stop appearing in reads. Nothing is refused on write. |
| Team members | 1 | 1 | Adding a member past the ceiling is refused. |
| Collaborators per project | 5 | 5 | Adding a sixth is refused. |
| Knowledge Base docs | 50 | 500 | Further uploads are refused. |
| Automatic analyses per day | 100 | 200 | The trace is still stored and scored on the deterministic rules. LLM scoring pauses until 00:00 UTC; run it on demand from Agent Intelligence at one credit per trace. The bell tells you once. |
| Projects | Unlimited | Unlimited | No ceiling. Use one project per environment. |
| Credits per cycle | 100 | 500 | New AI actions pause. See below. |
Live usage against each limit, and how each one is actually applied, is on Settings → Billing and usage, or over the API at GET /api/entitlements/usage.
Credits
A credit is the unit for AI work you ask PRISM to perform. Your plan grants an allowance once per rolling 30-day cycle, anchored to the date your organization was created rather than to the calendar month, so your cycle renews on your own date. New organizations also get a one-time welcome grant of 100 credits, and top-up packs of 100 can be bought at any time. Unused allowance carries over up to one full allowance, so an idle account does not accumulate indefinitely.
Free
Anything the platform does on its own. Trace ingest, viewing traces, the automatic per-trace analysis and its scores, trajectory assembly, regulatory classification, Knowledge Base processing, guardrail checks, dataset and evidence exports, and the onboarding and integration assistants. Free allows 25,000 traces against a 100-credit allowance, so metering automatic analysis would exhaust a cycle before you had taken a single action.
Metered
Actions you deliberately trigger. Prices follow one ladder: 1 for a single judgement, 2 for a recommendation, 5 for a multi-pass or report-sized job.
| Action | Credits |
|---|---|
| Re-run analysis on a trace, including each trace in a back-fill | 1 per trace |
| Agent Intelligence narrative | 1, once per project per day |
| Prompt improvement suggestion | 2 |
| Remediation recommendation | 2 |
| Analyse an uploaded document against a control | 2 |
| Generate test cases from an evaluation dataset | 2 |
| Run an evaluator task, or an experiment | 5 |
| Root-cause engine run over a project | 5 |
| Root-cause fix attempt: patch, replay, and pull request | 5 |
| Executive report | 5 |
At a zero balance
New AI actions pause, and nothing else does. Trace capture continues within your plan limits, existing data stays fully readable, automatic per-trace analysis keeps running, and guardrails and alerts keep working. An action you cannot afford returns 402 with the price and your balance, so your own tooling can handle it. There is no automatic overage and no auto top-up: the balance cannot go below zero without you buying more.
Security
- Keys live in the environment. A .env file locally, your platform secret
manager in production. Never hardcode a key, never commit one.
- Send the key as a header. Use X-PRISMtrace-Key. The deprecated body field
puts your credential into request logs and payload captures.
- Use the narrowest scope. An application that only sends traces should carry
an ingest key. It cannot then read your data back or spend credits.
- Rotate, do not swap. Rotation issues a new key while the old one keeps
working for a grace period. Roll out, then revoke.
- One project per environment. Dev, staging, and production each get their own
project and keys, so revoking one never touches the others.
- Keys are shown once. PRISM stores only a hash. If a key is lost, rotate it.
- Voice audio is never stored. ElevenLabs transcripts are PII-scrubbed
server-side before storage, and audio is never sent to PRISM at all.
- You choose what is stored. Settings then Data handling can drop prompt text,
response text, and error messages at ingest, keeping structure, timings, tokens, cost, model, and outcome.
- You can shorten retention. An org admin can set a window below the plan's,
over the API. It cannot be lengthened self-serve.
Troubleshooting
| Symptom | Cause | Fix |
|---|---|---|
| Dashboard is empty after integrating | Several causes look identical from outside. | Open Connection health. It names the stage that is stuck. |
| 401 "No credential was sent" | The header is missing, or the variable is unset in that environment. | Send X-PRISMtrace-Key. Do not switch to Bearer. |
| 401 "does not look like a key" | A project ID or an unexpanded shell variable was pasted in place of the key. | Use the pt-sk- value. |
| 403 naming a different project | The key and the project_id are from different projects. | Use the project ID in the message, or a key from the right project. |
| Traces arrive but no conversations | No shared session_id, so nothing assembles. | Send one session_id per conversation. |
| One agent appears as several | agent_id changes between runs. | Send a stable agent_id, not a generated one. |
| Scores are missing on recent traces | Analysis lags ingest. | Wait. This is not a setup failure and costs no credits. |
| 402 on an action you expected to work | Either a zero credit balance or a Builder-only feature. | Read error in the body: it distinguishes the two. |
| A LangChain integration sends nothing | Callbacks were never attached, or the process exited before a flush. | Pass callbacks=[handler] and call handler.flush(). |
| Looking for the npm package | There is not one. | Use the HTTP endpoint. |
Reference
| Item | Value |
|---|---|
| Platform | https://prism.blockconvey.com |
| API base URL | https://prism.blockconvey.com |
| Ingest endpoint | POST /api/traces |
| Authentication | X-PRISMtrace-Key header. Not a bearer token. |
| Key format | pt-sk-…, shown once at creation |
| Required fields | project_id, model, input_messages, output_message, latency_ms |
| Groups a conversation | session_id |
| Rate limit | 2,000 requests per minute, per ingest endpoint |
| Python SDK | pip install prismtrace-sdk, then import prismtrace |
| JavaScript SDK | None. Use the HTTP endpoint. |
| Proxy routes | /proxy/anthropic, /proxy/openai/v1, /proxy/gemini |
| Project ID | Settings → Project |
| Plans | Free and Builder |
| Support | Tech@blockconvey.com |
PRISM agent integration brief
You are a coding agent working inside an application repository. Your job is to wire live tracing into PRISM so sessions, model calls, tool use, errors and latency appear in the PRISM dashboard.
Read this document fully before editing. Propose a plan, then make the smallest change that emits real traces.
Non-negotiables
- Authenticate with the header
X-PRISMtrace-Key. This is not a bearer token.Authorization: Bearercarries dashboard sessions and will 401 an API key. - Do not invent credentials, project ids or hosts. Use exactly the values the operator supplies.
- Do not install an npm package. None exists. For JavaScript and TypeScript, POST to the HTTP endpoint.
- Do not commit secrets.
.envstays untracked; put key names only in.env.example. - Do not report success from a handshake alone. A handshake proves a credential, not an integration.
- Do not point production traffic at an unverified setup without explicit approval. Instrument staging first.
- Editing files is not the deliverable. A trace arriving in PRISM is.
Required inputs
| Variable | Format | Where the operator finds it |
|---|---|---|
PRISMTRACE_HOST | https://prism.blockconvey.com | Fixed. This is the only public host. |
PRISMTRACE_PROJECT_ID | UUID | Settings, Project tab |
PRISMTRACE_API_KEY | pt-sk-... | API keys page. Shown once at creation. |
If any is missing, stop and ask. Do not guess and do not read them out of an unrelated service.
Step 1: choose a path
Choose from repository evidence, not from what the operator says the stack is. Grep the repository. Take the first rule that fires.
| Evidence | Path |
|---|---|
langchain, langgraph, LlmAgent, litellm or agents.Runner in Python | Python SDK |
anthropic.Anthropic, openai.OpenAI, google.generativeai or AzureOpenAI called directly, no framework wrapper | Zero-code proxy |
opentelemetry, OTEL_EXPORTER_OTLP_ENDPOINT, an OTel Collector config, in any language | OpenTelemetry (OTLP) |
package.json, tsconfig.json, .ts / .tsx, Next.js, Vercel AI SDK | HTTP ingest |
| Anything else | HTTP ingest |
AWS Bedrock is none of these. It connects with AWS credentials stored in the PRISM dashboard, not from application code.
Do not run pip install in a repository that contains no Python.
Step 2: instrument
Symbols that exist
Import these from prismtrace. The distribution is prismtrace-sdk; the import package is prismtrace. They differ on purpose.
| Symbol | Use for |
|---|---|
PRISMtrace | Manual client. Has trace_llm, submit_trajectory and a trace decorator. |
PRISMtraceCallbackHandler | LangChain |
PRISMtraceLangGraphHandler, wrap_langgraph | LangGraph |
PRISMtraceADKAdapter | Google ADK |
install_litellm | LiteLLM |
install_openai_agents | OpenAI Agents SDK |
ClaudeAgentTracer | Anthropic Messages API |
PRISMtraceVoiceTracer, install_elevenlabs_voice | ElevenLabs voice agents |
PRISMtraceTracingProcessor | OpenAI Agents, if you wire the processor yourself |
session, bind_session, unbind_session, current_session, resolve_session | Ambient session identity. with prismtrace.session("conversation-1"): groups a run without threading an id through every call. |
PRISMtraceInstrumentor, PRISMtraceSpanExporter | In-process OpenTelemetry, when you are already on this SDK and do not want to run an exporter |
Symbols that do not exist
Do not write any of these. Each has been produced by a model before, and each fails on the import line.
PRISMtraceLangchainCallback— the export isPRISMtraceCallbackHandler@prismtrace/sdk,prismtrace-js, or any npm packagemonitor(),wrap_bedrock(), or ablockconveymoduleprism-sdkorprismsdkas the pip distribution. It isprismtrace-sdk- OTLP over gRPC. Only OTLP over HTTP is served, protobuf or JSON encoded, at
POST /api/otlp/v1/traces.
Install
pip install "prismtrace-sdk>=0.4.3"Current release: 0.5.0. The floor is 0.4.3, where prismtrace.session and handler.close() arrived. Reading a framework's own conversation id (LangGraph thread_id, ADK session_id) needs 0.5.0.
LangChain
import os
import prismtrace
from prismtrace import PRISMtraceCallbackHandler

# Once, at startup. Safe to share across concurrent runs.
handler = PRISMtraceCallbackHandler(
    api_key=os.environ["PRISMTRACE_API_KEY"],
    project_id=os.environ["PRISMTRACE_PROJECT_ID"],
    host=os.environ["PRISMTRACE_HOST"],
    agent_name="my-agent",
)

with prismtrace.session("conversation-1"):
    ...  # pass callbacks=[handler] into your chain, agent or RunnableConfig

handler.close()   # at shutdown; flushes first
Success for LangChain is a real application invocation that flushes spans. A curl to /api/traces proves the credential only; it does not attach callbacks.
LangGraph
import os
import prismtrace
from prismtrace import PRISMtraceLangGraphHandler, wrap_langgraph

handler = PRISMtraceLangGraphHandler(
    api_key=os.environ["PRISMTRACE_API_KEY"],
    project_id=os.environ["PRISMTRACE_PROJECT_ID"],
    host=os.environ["PRISMTRACE_HOST"],
    agent_name="my-graph",
)
graph = wrap_langgraph(compiled_graph, handler)

with prismtrace.session("graph-run-1"):
    graph.invoke({"messages": [("user", "hello")]})

handler.close()
wrap_langgraph injects callbacks on invoke and stream, so you do not thread config through every call site. Success is one real invoke or stream that flushes spans.
A graph that already passes thread_id needs no session block. From SDK 0.5.0 the handler reads the conversation id the framework was already given, so graph.invoke(state, config={"configurable": {"thread_id": tid}}) groups every turn of one thread onto one session. The same applies to Google ADK's Runner.run(session_id=...). The precedence is fixed: an explicit session_id= on the handler wins, then an open prismtrace.session(...), then the framework's id, then an anonymous per-handler id that groups nothing. Each trace records which of those answered as sdk.session_origin in its metadata, so a conversation that did not group can be diagnosed without reading the application's source.
Grouping a conversation without threading an id
session_id is what turns separate traces into one conversation. If passing it through every call site is awkward, open an ambient session instead and every trace emitted inside the block inherits it.
import prismtrace

with prismtrace.session("conversation-1"):
    ...  # any traced call in here is filed under conversation-1
Requires prismtrace-sdk 0.4.3 or newer. On an older install prismtrace.session raises AttributeError at the call, not at import, so pin the floor above if you use it.
Do not pass session_id= to the handler constructor unless the handler really is per-conversation: a constructor argument pins one value for the handler's whole life, and an app that builds one handler per agent then gets one session per agent.
Google ADK
import os
from prismtrace import PRISMtraceADKAdapter
from google.adk.agents import LlmAgent

adapter = PRISMtraceADKAdapter(
    api_key=os.environ["PRISMTRACE_API_KEY"],
    project_id=os.environ["PRISMTRACE_PROJECT_ID"],
    agent_name="my-adk-agent",
)

agent = LlmAgent(
    model="gemini-3.6-flash",
    instruction="You are a helpful assistant.",
    before_model_callback=adapter.before_model,
    after_model_callback=adapter.after_model,
    before_tool_callback=adapter.before_tool,
    after_tool_callback=adapter.after_tool,
    before_agent_callback=adapter.before_agent,
    after_agent_callback=adapter.after_agent,
)
ADK does not deliver errors through its callbacks. Wrap model and tool calls and forward the exception explicitly, or failed turns are missing from the trajectory:
try:
    ...
except Exception as exc:
    adapter.record_model_error(exc, callback_context=ctx)
    raise
LiteLLM
import os, litellm
from prismtrace import install_litellm

install_litellm(
    api_key=os.environ["PRISMTRACE_API_KEY"],
    project_id=os.environ["PRISMTRACE_PROJECT_ID"],
)
One call at startup registers a success and failure callback. Do not wrap individual call sites; that defeats the point of LiteLLM.
OpenAI Agents SDK
import os
from agents import Agent, Runner
from prismtrace import install_openai_agents

install_openai_agents(
    api_key=os.environ["PRISMTRACE_API_KEY"],
    project_id=os.environ["PRISMTRACE_PROJECT_ID"],
)
TypeScript and JavaScript
There is no package to install. Instrument the completion handler so each turn POSTs one trace.
const res = await fetch(process.env.PRISMTRACE_HOST + "/api/traces", {
  method: "POST",
  headers: {
    "Content-Type": "application/json",
    "X-PRISMtrace-Key": process.env.PRISMTRACE_API_KEY,
  },
  body: JSON.stringify({
    project_id: process.env.PRISMTRACE_PROJECT_ID,
    model: "gpt-4o-mini",
    input_messages: [{ role: "user", content: input }],
    output_message: output,
    latency_ms: latencyMs,
    session_id: sessionId,
  }),
});
if (!res.ok) throw new Error("PRISM ingest " + res.status + ": " + (await res.text()));
On serverless, await the call so the function is not frozen mid-POST.
OpenTelemetry (OTLP)
Nothing to install and no code change. A service already instrumented with OpenTelemetry points its existing exporter at PRISM.
OTEL_EXPORTER_OTLP_ENDPOINT=https://prism.blockconvey.com/api/otlp
OTEL_EXPORTER_OTLP_PROTOCOL=http/protobuf
OTEL_EXPORTER_OTLP_HEADERS=X-PRISMtrace-Key=$PRISMTRACE_API_KEY
Do not append /v1/traces yourself. The OTLP specification appends the signal path to OTEL_EXPORTER_OTLP_ENDPOINT, so the endpoint above resolves to POST /api/otlp/v1/traces on its own. Appending it by hand produces /api/otlp/v1/traces/v1/traces, which 404s.
Set the protocol explicitly. Both http/protobuf and http/json are served; gRPC is not, and the Java SDK defaults to it. An exporter left on gRPC batches and fails asynchronously, so the symptom is no traces and no error.
The API key alone identifies the project, so no project id is needed in the payload. If you do set one, use the resource attribute prismtrace.project_id, and it must belong to the same project as the key or the export is refused.
Attributes follow the OpenTelemetry GenAI semantic conventions (gen_ai.request.model, gen_ai.usage.input_tokens, gen_ai.conversation.id and the rest). If your instrumentation already emits them, there is nothing further to add.
Multi-turn grouping is declared, never inferred. Each turn arrives as its own OTel trace. Turns are stitched into one session only when spans carry gen_ai.conversation.id, session.id or prismtrace.session_id (span attributes first, then resource attributes). Without one there is no multi-turn trajectory to evaluate, and the export response carries X-PRISMtrace-Sessionless-Traces. Set the line the framework needs:
- OpenInference (LangChain, CrewAI, LlamaIndex, ADK and others):
using_session()forsession.id, orsession_id/conversation_id/thread_idin the LangChain runmetadata=. First match wins. - LangGraph:
config["configurable"]["thread_id"]is enough. A plain LangChain Runnable does not propagate it, so a bare chain needs the id inmetadata=too;metadata=is the portable choice when you do not know which the customer has. - openllmetry / Traceloop: set
conversation_id, which lands ingen_ai.conversation.id. An id kept intraceloop.association.properties.chat_idneeds the project setting below. - Google ADK, agno on third-party OTel instrumentation: set
prismtrace.session_idas a resource attribute on the exporter. On the PRISM SDK adapter, nothing: it reads ADK's session itself. - Anything else:
prismtrace.session_id, or the project setting below.
A project can name a non-standard key with otlp_session_attribute (PATCH /api/projects/{id}). It is read only when none of the three standard attributes is present; it never overrides a declared id and cannot help when the id was never put on the span.
Success is a real request through the instrumented service, then check 2 below. A zero-span export returns 200 and proves nothing.
Zero-code proxy
No import and no call-site change. Swap the base URL. Guardrails then run on the call itself: a blocked request never reaches the provider, and a blocked response is withheld while the original is still recorded.
import anthropic, os

client = anthropic.Anthropic(
    api_key=os.environ["ANTHROPIC_API_KEY"],
    base_url="https://prism.blockconvey.com/proxy/anthropic",
    default_headers={"X-PRISMtrace-Key": os.environ["PRISMTRACE_API_KEY"]},
)
Three routes exist and only three:
| Provider | Base URL |
|---|---|
| Anthropic | https://prism.blockconvey.com/proxy/anthropic |
| OpenAI | https://prism.blockconvey.com/proxy/openai/v1 |
| Gemini | https://prism.blockconvey.com/proxy/gemini via client_options={"api_endpoint": ...} |
Azure AI Foundry uses the OpenAI route with an x-azure-endpoint header naming your resource.
Step 3: verify
This step is required. Run both checks. Every request sends X-PRISMtrace-Key. If a response says "Missing bearer token" or "Invalid or expired token", you used the wrong header. Add X-PRISMtrace-Key and retry once. Do not invent a JWT.
Check 1: prove the credential
curl -sS -X POST "https://prism.blockconvey.com/api/setup-doctor/handshake" \
  -H "Content-Type: application/json" \
  -H "X-PRISMtrace-Key: $PRISMTRACE_API_KEY" \
  -d '{"project_id": "'"$PRISMTRACE_PROJECT_ID"'", "send_test_trace": true}'
This endpoint always authenticates and its errors are specific. Read detail and act on it rather than retrying.
| Response | Meaning | Action |
|---|---|---|
200 ok | Credential valid, test trace stored | Continue to check 2 |
401 no credential was sent, or "No API key was sent" | Header missing or variable unset | Export it, add the header, re-run |
401 does not look like a PRISM API key | Wrong value pasted, often the project id | Use the pt-sk- value |
401 was revoked | Key is dead | Ask for a new key. Do not retry. |
401 not recognised | Truncated paste or a key never saved | Ask for a new key |
401 that is a PRISM API key | Sent as Authorization: Bearer | Use X-PRISMtrace-Key |
403 belongs to project ... | Key and project_id are from different projects | Use the project id in the message |
404 | Project does not exist | Re-check PRISMTRACE_PROJECT_ID |
The project is checked before the key, so a wrong PRISMTRACE_PROJECT_ID with a missing key answers 404, not 401. Fix the project id first, then read the next response.
Check 2: confirm real traffic arrived
curl -sS "https://prism.blockconvey.com/api/setup-doctor?project_id=$PRISMTRACE_PROJECT_ID" \
  -H "X-PRISMtrace-Key: $PRISMTRACE_API_KEY"
In a Python repository you may run python -m prismtrace.verify instead. In a TypeScript repository use curl; do not install Python to verify.
On the OTLP path there is no flush() to call. The exporter batches on its own schedule, so allow one batch interval (5 seconds by default) between the request and this check, or force a flush through your tracer provider's shutdown. Checking immediately and reading blocked_step: event_received is the expected result of not waiting, not a failure.
Read live_connected and blocked_step.
| Field | Meaning |
|---|---|
live_connected: true | A real, non-demo trace arrived. Report LIVE CONNECTED. |
app_connected: true | The stricter one: the trace came from the customer's own application, not a dashboard test. Prefer it when both are present. |
blocked_step: event_received | Credential works, the application sent nothing |
blocked_step: trace_normalized | Traces arrived without a shared session_id |
blocked_step: analysis_ready | Traces arrived; scoring is still catching up. Not a setup failure. |
Step 4: report
End with these lines and nothing vaguer.
CREDENTIAL OKorCREDENTIAL FAIL — <reason>LIVE CONNECTED — PRISM is receiving live traces from <what you instrumented>.- or
WAITING FOR LIVE — <blocked_step> — <next action>.
Then list files changed, remaining manual steps, and risks.
"I have edited your files" is not an acceptable final answer.
When you cannot run the application
Proving a live trace usually means starting the application, which needs provider keys, a database and a runtime. Sandboxes often have none of these. That is not a failed setup.
If the handshake returned 200, the code is wired and credentials are in the environment and .env.example:
- Stop. Do not loop. Do not ask for OpenAI, Anthropic or database keys purely to verify.
- Report
CREDENTIAL OKandWAITING FOR LIVE — instrumented, credential proven — a human must run the application once in their own environment.
That is an acceptable final answer. Handshake-only is never LIVE CONNECTED.
API contract
Base URL https://prism.blockconvey.com. Auth header X-PRISMtrace-Key on every request.
POST /api/traces
| Field | Type | Required | Notes |
|---|---|---|---|
project_id | string | yes | Project UUID |
model | string | yes | Model name |
input_messages | array | yes | Objects of {role, content} |
output_message | string | yes | Agent reply |
latency_ms | int | yes | Send 0 if unmeasured |
trace_id | string | no | Your id. Re-sending returns the existing trace rather than duplicating. |
session_id | string | no | Groups traces into one conversation. Without it nothing assembles. |
user_identifier | string | no | Your end-user id |
agent_id | string | no | Stable agent id. Model Inventory and agent-scoped alerts match on it. |
agent_name | string | no | Display name |
token_count_input | int | no | Defaults to 0 |
token_count_output | int | no | Defaults to 0 |
metadata | object | no | Free-form, filterable |
session_id, user_identifier, agent_id and agent_name are also read from inside metadata for older callers. Top level wins.
An api_key body field still authenticates and is deprecated; responses using it carry X-PRISMtrace-Deprecation. Use the header.
Returns 200 with the stored trace, including id and cost_usd.
POST /api/spans/ingest
Used by the SDK handlers, not usually by you directly. Body is {trace_id, project_id, spans[], session_id?, metadata?}. Each span carries name, span_type, start_time, and optionally span_id, parent_span_id, input_text, output_text, end_time, duration_ms, status, error_message, token_count_input, token_count_output, cost_usd, model.
POST /api/otlp/v1/traces
Standard OTLP/HTTP. You do not build this request; an OpenTelemetry exporter does. Point it at /api/otlp and the exporter appends /v1/traces itself.
| Aspect | Value |
|---|---|
| Content types | application/x-protobuf, application/protobuf, application/json |
| Not served | gRPC. application/grpc returns 415 naming the fix. |
| Auth | X-PRISMtrace-Key, via OTEL_EXPORTER_OTLP_HEADERS. The key alone identifies the project. |
| Project override | Resource attribute prismtrace.project_id. Checked against the key; a mismatch is refused even when other ingest paths are in soft auth mode. |
| Partial failures | Reported in the partialSuccess field of a 200, never as a 4xx, because an OTLP client retries any non-2xx forever. |
| Attributes | OpenTelemetry GenAI conventions. prismtrace.* attributes override them. |
An empty export is legal and returns 200 with an empty body. It proves the endpoint is reachable and proves nothing about your instrumentation.
Errors
| Status | Meaning |
|---|---|
401 | Missing or invalid credential. Body says which. |
403 | Valid key, wrong project, or missing scope for this call |
402 | insufficient_credits carries price and balance; plan_limit_reached names the limit |
404 | No such project |
429 | Rate limited. Each ingest endpoint allows 2,000 requests per minute. |
Over a plan volume ceiling the trace is still stored and the response carries X-PRISMtrace-Plan-Warning.
Key scopes
| Scope | Allows |
|---|---|
ingest | Send traces and spans. This is what an application should carry. |
read | Read traces, analyses and balances |
operate | Trigger actions that spend credits |
Use an ingest-scoped key in application code. A read-only key returns 403 on ingest by design.
Data controls that change what you can promise
Two project settings change the outcome, and an integration report that ignores them will be wrong.
- Content-free ingest (Settings, Data handling). Prompt text, response text and error messages are dropped at ingest; structure, timings, token counts, cost, model and outcome are kept. A content-free trace is never sent to the LLM judge, so it gets no automatic quality scores and no Evaluators Hub scores, and is not billed for either. Deterministic guardrail rules still run. New traces only. OTLP traffic inherits the setting, and on that path it is the only control, because a stock exporter cannot ask per request.
- Retention can be shortened below the plan window by an org admin over the API. It cannot be lengthened self-serve.
If the operator has content-free ingest on, do not report that scoring will appear. Report that traces are arriving and that scoring is off by their own configuration.
Account limits
Two independent systems. Plan limits are capacity; credits meter AI actions you trigger. Neither hides data already captured.
| Limit | Free | Builder |
|---|---|---|
| Traces per month | 25,000 | 250,000 |
| Distinct models | 5 | 20 |
| Retention | 14 days | 90 days |
| Workspace members | 1 | 1 |
| Collaborators per project | 5 | 5 |
| Knowledge Base documents | 50 | 500 |
| Automatic analyses per day | 100 | 200 |
| Projects | unlimited | unlimited |
| Credits per 30-day cycle | 100 | 500 |
Free and Builder are the only plans. Guardrails, the Evaluators Hub and the expanded Model Inventory require Builder; everything else works on Free.
Zero credits are charged for anything you do while integrating: trace ingest, span ingest, reading traces, automatic per-trace scoring, trajectory assembly, and guardrail checks are all free. Credits are spent only on actions a human deliberately triggers in the dashboard.
Automatic scoring has a daily ceiling per workspace (100 on Free, 200 on Builder). Past it, traces still store and the deterministic checks still run; LLM scoring pauses until 00:00 UTC and the notification bell says so once. If a trace shows skipped_quota as its judge status, report it as the plan ceiling, not as a failure of your integration.
At a zero balance, new AI actions pause. Ingest, reads, automatic scoring, guardrails and alerts all continue. Your integration cannot be blocked by a credit balance.
Failure modes
| Symptom | Cause | Fix |
|---|---|---|
| 401 on every request | Bearer used instead of the key header | Send X-PRISMtrace-Key |
| 403 naming another project | Key and project id mismatched | Use the project id in the message |
Handshake 200 but live_connected false | Nothing real has been sent yet | Run the application once |
| Traces arrive, no conversations | No shared session_id | Send one value per conversation |
| One agent appears as several | agent_id changes between runs | Send a stable agent_id |
| Import error on a PRISM symbol | The symbol does not exist | Check the symbols table above |
pip install fails in a JS repo | Wrong path chosen | Use HTTP ingest |
| Scores missing on new traces | Scoring lags ingest | Wait. Not a setup failure and not billed. |
| OTLP: no traces and no error at all | Exporter defaulted to gRPC, which is not served. It batches and fails asynchronously, so nothing surfaces. | Set OTEL_EXPORTER_OTLP_PROTOCOL=http/protobuf |
OTLP: 404 on export | /v1/traces was written into OTEL_EXPORTER_OTLP_ENDPOINT, so the exporter requested it twice | Set the endpoint to .../api/otlp and let the exporter append |
OTLP: 415 | gRPC content type, or an encoding that is not protobuf or JSON | Read detail. It names the protocol to set. |
| Traces arrive with no scores, and none are coming | Content-free ingest is on for the project | Expected. Report it as the operator's setting, not a failure. |